Could I ask you again? How many schools other than the 50 listed met your screening criteria?
As I recall, approximately 10.
1 Like
Shouldn’t the median be found within this grouo of ~10, rather than at Colby/Swarthmore? To be clear, I’m not seeking to be critical of the analysis. This is just a question that arose when considering the information.
Yes, the average and median changed slightly after making minor updates including adjusting for the previously noted 5 colleges. Looking at my spreadsheet, it shows average of 53% and median of 50%, with the median college being Davidson.
1 Like
It would seem that a college with a notably low percentage of students who submitted scores would have an inherent standardized scoring variation not too dissimilar to that of a public high school, although, in cases of colleges with low acceptance rates, it’s likely that the profile for the college would be skewed substantially upward.
Okay thats great, that still doesnt discredit what I said.
Emory reports 601 submission of the SAT and 554 of the ACT last year thats 1155 total or 80% of the 1450 freshman class. The only way to get to 62% tests submission is to remove those who submitted both the SAT and ACT. You just made up your own number you feel comfortable with.
OP stated the assumption they made to adjust for students who reported both ACT and SAT, obviously you are free to use a different assumption.
Separately, I will note that there is an issue with Emory’s reporting of the number who submitted an ACT in the dashboard link you provided…the number reporting the ACT test does not match what’s in the CDS (which matches IPEDS, which is the database OP used and is for 2023/class of 2027 data.) The dashboard numbers are quite a bit higher than the CDS.
ACT reporters:
2020: Dashboard 1,058 CDS 529
2021: 818/409
2022: 670/335
2023: 554/277
2024: No CDS yet
The SAT reporters in the Dashboard and CDS do match. So, Emory has an issue with their reporting, and the error is probably on the Dashboard, not the CDS. But could be the other way too.
For the dashboard, there is this footnote on both the SAT and the ACT page:
![]()
Suggesting the dashboard only reflects unique reporters. So, I wonder if those ACT numbers are actually the total SAT plus ACT reporters? That could explain why the ACT numbers are so high. Maybe I’ll call them next week.
No matter how you slice it, test optional kids are a significant slice of the total at selective institutions. Really wonder why bother testing if tests truly don’t matter.
2 Likes
I don’t think it’s correct to conclude that tests don’t matter. I think they are weighed differently at different colleges and for different types of applicants.
Where it gets tricky is in the area of yield likelihood and the extent to which a yield algorithm score, for an individual applicant’s likelihood of enrolling, has a significant role in the admission process. Enrollment management was thrown for a loop in the first year(s) of test optional policies. Test optional applicants may be, on average, more likely to enroll, as a selective college that admits a TO applicant is more likely to have been a (bigger) reach for that applicant.
It seems to me that highly selective schools where 2/3 to 3/4 of enrolled students submitted scores are probably giving some significant weight to scores. Maybe not as much as before test optional, but many applicants might be better off submitting than not if they are close to the reported range. Just my guess.
1 Like
But how does one know that? How do you know if you are a type of applicant to take as TO or not outside of sports recruits? How does one know if school thinks you will yield? They don’t know this. One family might value a certain school despite a price tag over the other family.
To me schools taking in half the kids test optional means tests aren’t valued. I have no other way of reading this.
And how does one make a decision how to proceed?
1 Like
The problem that applicants don’t know how they are being evaluated is a significant and persistent problem, the apparent black box. Back in olden times when tests were required at almost all highly selective universities, when a kid had somewhere around 3.8 to 4.0 uw, the most straightforward way to get a very rough idea of admission chance was to compare their test score to the college’s reported range.
I think decisions on whether a low-scoring applicant should submit may seem a little complicated. I suspect that at some highly selective schools, there may be little practical difference in submitting a low score vs not submitting, but other schools that are more focused on their reported range than on their reported % submitters (such as the example you mention of a school where only half of enrolled students submit), the low score may be more unhelpful for admission chances than applying TO. I’d also factor into the submission decision what the student’s grades/GPA are like, what scores are like at the student’s high school, whether the student is disadvantaged, whether the high school is well known to admission officers in a way that makes the grades reliable or conversely not well known so that the grades are not as reliable.
And the rigor evaluation is a whole other can of worms.
And of the example you mention, of a school where only half of enrolled students submit, it is unclear the extent to which a high score is valued. I don’t think we can say it doesn’t matter at all, but it’s unclear. It’s not just the low scoring applicants that have difficulty understanding their chances. It’s harder under a TO scenario for high scoring (or middle-scoring) applicants to understand their chances as well. Greater uncertainty for chances makes for difficulty choosing colleges and often for a longer college list, which in turn breeds more uncertainty in the aggregate, a vicious cycle.
1 Like
Also if half the kids aren’t submitting scores, I would argue all the reported scores (25% or 85%) are now high scores.
This is another problem. In a test required world, understanding what is a high score and a low score was straightforward. In a TO world what is a low score?
1 Like
There may be some value in looking at the reported ranges when scores were last required, in the 2020-21 CDS. Application volume may have caused an increase in uncertainty beyond the effect of TO, but it seems likely that the 20-21 CDS provides some clue.
1 Like
That’s what we did.
1 Like
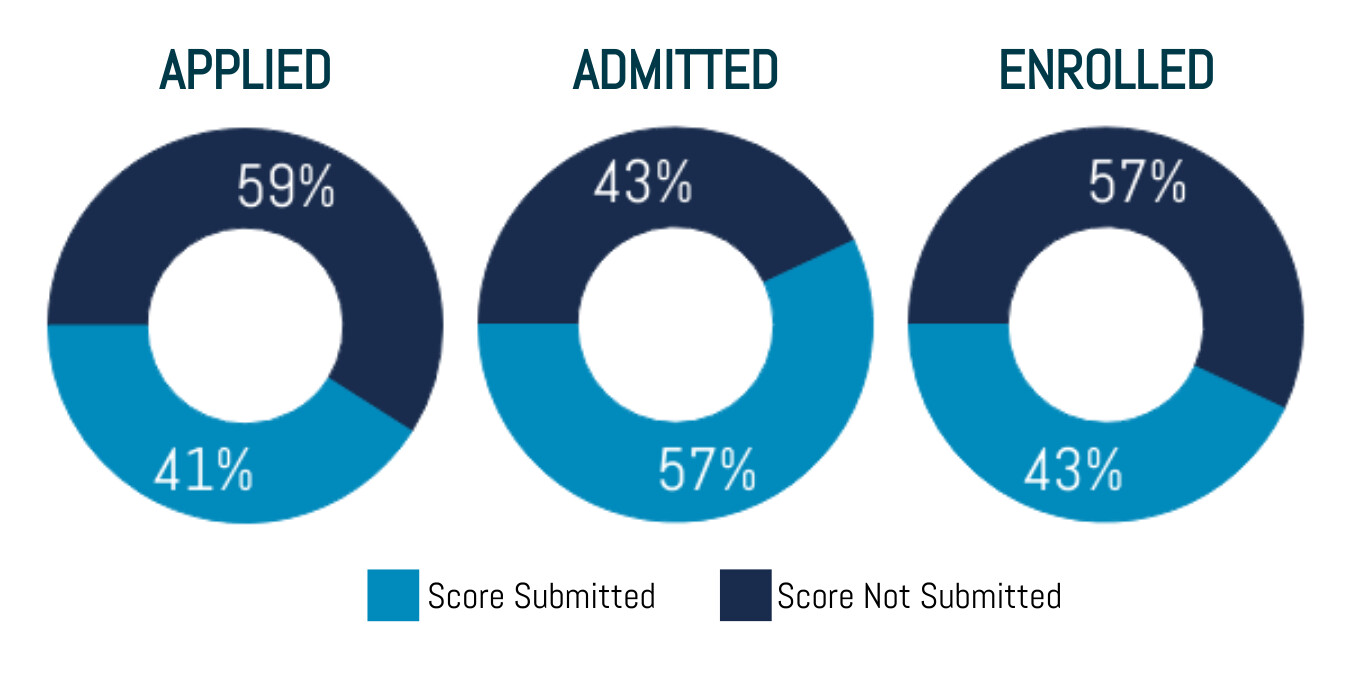
Just ran across this looking at Washington and Lee, and they actually identify percent of applicants submitting test scores, percent accepted with test scores, and then percent that matriculated with test scores for the class of 2028. The interesting thing is that it does look like they have a “preference” for test scores with a higher percentage of admittances with test scores. BUT, then the kids that actually enroll are more likely to be those that did not submit test scores.
Just to be clear again, W&L is not among the schools that told us 1500 or above.
Ah, sorry! I missed that. Will edit.
1 Like
I do think it’s great that W&L provides this specific information, it would be nice if other schools did as well.
1 Like
This seems to indicate that accepted applicants with high test scores have a greater range of options when deciding on which college to attend.
2 Likes
Yep, that’s how I’m interpreting it as well - you have a better chance of getting in with test scores AND you have a better chance of getting in elsewhere with test scores.
I wonder if this is a reason why some schools would want to keep test optional - they have a higher likelihood of yielding them?