Stanford, Harvard, Dartmouth, Yale, Penn, Brown, CalTech, JHU, and UT-Austin to Require Standardized Testing for Admissions

The SAT/ACT doesn’t cover calculus, and it’s far from a consistently reliable indicator of whether the student can hack calculus. Being able to hack calculus also isn’t a requirement at typical highly selective private colleges, such as the one you mention (Dartmouth). For example, you mentioned being able to take “Concepts in Statistics” at a public U to fulfill math distribution requirement. Dartmouth’s quantitative and deductive science general ed requirement can also be fulfilled by passing a single class in Introductory Statistics. No further math classes are required to graduate. Some highly selective private colleges don’t require taking any math classes to graduate.

Public U’s are far more likely to admit by major than highly selective private colleges. Stanford/Harvard/Dartmouth’s do not admit by major, and make it simple to switch majors. All of these colleges offer many majors that are not math heavy, which are usually perceived as easier by students. And a good portion of students at Stanford/Harvard/Dartmouth’s do change majors from math-heavy fields to fields that use little math, in many cases because they get some non-A grades. Unsatisfactory performance in an absolute sense (failing or near failing) is almost unheard of, regardless of whether admitted with or without tests. Even having GPAs below A/A- is becoming rare. For example, in the most recent class of 2025 Harvard senior survey, the median self-reported GPA was 3.9 out of 4.0. Only 6% of seniors reported having a GPA of below 3.5.

The Duke Study at https://cepa.stanford.edu/sites/default/files/grades_6.0.pdf reviewed what happened to a group of hooked students at Duke that were admitted with subpar academic qualifications – lower grades, lower rigor, lower scores, worse LORs, worse essays, … They found a substantial 26% expected to major in a math heavy field, but ended up majoring in a humanities / social science field instead. Among the full class, a much smaller 11% switched from a math-heavy to math-light major. Among the hooked students that switched major, mean SAT was 1270. Among the hooked students that successfully persisted in the math-heavy major, mean SAT was 1289. Other criteria showed a stronger relationship with major switching than test score such as harshness of grading within specific Duke classes, gender, and HS course rigor.

I am not aware of any studies that reviewed whether test optional kids were more likely to switch majors. There are studies that compare rate of receiving degrees in different majors, but they don’t distinguish between starting in particular majors vs switching. For example, the Bates review found that math, physics, and philosophy majors were all more likely to be test submitters than the overall average. Is that because Bates admits who are interested in math, physics, and philosophy tend to have higher test scores than average? Or is that because Bates students with relatively lower scores are switching out of those majors?

The Bates review found that both graduation rate and cumulative GPA of graduates was nearly identical between submitters and non-submitters. It doesn’t support the idea of non-submitters not being able to graduate. This review was done several years ago, before there was influence from COVID effects.
4 Likes

That doesn’t seem right. The SAT Math section assesses proficiency in areas like algebra, geometry, and some trigonometry, which are foundational for calculus. I bet if we plotted the SAT Math scores of students on one graph, and their first-year college calculus scores on a 2nd graph, the graphs would look similar.

2 Likes

Capable is such a broad term that it is of almost no value to this conversation. How many academically elite applicants are the most selective universities missing out on by requiring standardized tests? Likely very, very few.

1 Like

I agree that a graph would show a notable correlation. My post said “far from a reliable indicator”, not that there was no correlation. While there is a notable correlation, there are also countless individual students who are exceptions. Looking at SAT score alone is not sufficient to evaluate calculus proficiency.

Words like “capable” may not have any value to you because of the way you view admissions, but to me finding students capable of doing the work and succeeding is the key to admissions and should be at the core of the discussion.

Seems like you are just guessing. Do I have that correct? And I have no idea what you mean by “academically elite” but it sure sounds like you are stacking the deck.

Contrary to your guess, my understanding is that Test Optional and Test Blind policies have been successful in increasing both applications and acceptances among groups of students who previously had not bothered to apply. So more than you seem to believe.

2 Likes

A notable correlation to me suggests reliability.

Webster’s defines reliability as “giving the same result on successive trials.” Many variables with a notable correlation do not lead to the same result on successive trials. For example, math SAT score shows a notable correlation with employer salary after graduating. If you grouped students by math SAT ranges and reported average employer salary of those groups, you’d see a clear correlation where as math SAT score went up, average employer salary went up. Nevertheless, I would not consider math SAT score as a reliable indicator of future employer salary because there are countless individual students who are exceptions. Some students with high math SAT score do not work in especially high income career fields. You’d get a more reliable prediction of having a high/low employer salary, if you considered more criteria than just math SAT score.

It’s a similar idea with math SAT score and calculus success. Yes, there is a notable correlation, if you look at any kind of average. However, there are countless individual students that are exceptions to that average – a higher/lower SAT score than peers, but not a higher/lower calculus grade than peers.

One can easily think of numerous scenarios where the opposite relationship to the correlation might occur. For example, maybe the student is prone to careless errors when rushing through simple multiple choice questions at high speed, but does better when slowly and thoughtfully thinking through longer problems where you show work and get credit for work. Maybe the student can handle short and simple multiple choice algebra/trig questions, but struggles with more advanced mathematics like calculus/proofs. Maybe the student didn’t get a lot of sleep on the night before because he/she was stressed out about what he/she believed to be the most important test of life. Maybe the student does well when their parents are forcing them to study for exams, but prefers to drink and party without studying when there is no parental supervision. Maybe the student chooses to ignore the placement test recommendation and instead take the most rigorous possible level in spite of not having taken the prerequisites during HS (I did this at Stanford and struggled in freshmen physics, in spite of having 800 math SAT) I could continue.

4 Likes

That was the case of a former student who couldn’t get more than 24 on the math ACT yet got straight As in all her math classes for an ABET accredited Civil Engineering program.

1 Like

Are you open to the idea that this student was unusual?

1 Like

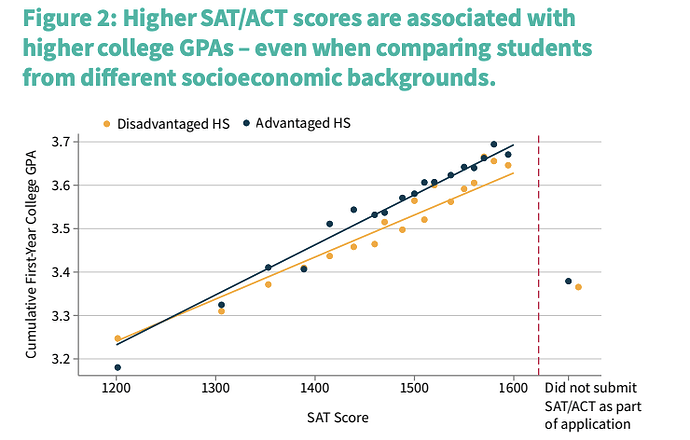
I didn’t do a deep dive into this data, but the below graph from the paper at your link tells me that students with a 1200 SAT (whether advantaged or disadvantaged) are successful at the set of “Ivy Plus” colleges OI looked at.

There is nothing wrong nor concerning about a first year student who has around a 3.2 college GPA, clearly they can do the work at the college they are attending. FWIW, I know physicians who scored in the 1200s on their SAT.

2 Likes

How do you define “successful”? With grade inflation, I wonder what percentile a 3.2 is for class rank at these elite college. I suspect in the 25-50% range - lower 3rd quartile?

A 3.2 is well above the minimum to graduate (typically 2.0), and is above the 3.0 that is the most common initial college GPA screen by employers hiring new graduates. Of course, it likely will not be sufficient at those relatively few employers looking for higher college GPAs, or the more competitive graduate and professional programs.

Most of the more selective colleges are far more competitive for admission than the minimum academic indicators that indicate likelihood of successfully graduating.

Of course, those with lesser academic indicators for admission are likely to be the strongly hooked ones, and their post-graduation paths may also be strongly hooked as well, so their college GPA may be less relevant to them than for most college graduates.

1 Like

True

also true

I still suspect they are in the bottom half of their class rank even with a 3.2.

1 Like

At a few Ivy League colleges, they would place in the bottom 10%.

I would be more inclined someone from a state flagship with a 3.2 than someone from an Ivy with grade inflation with that same GPA. The person from the state school likely had to work harder to earn that GPA, and learned more while doing so.

5 Likes

Only on CC would anyone debate if a 3.2 GPA is successful. Who cares what their percentile in the class is? I’m one of the only posters who works and/or has worked in admissions at highly rejective universities, and that’s my takeaway from that chart.

I assume you mean hire someone. And that’s your prerogative of course. I’m not sure everyone would agree with you, especially if the 3.2 is in a tough major like engineering. Remember also these data represent just first year GPA, not graduating GPA.

4 Likes

The graph above only includes first year GPA. It’s not GPA at graduation, which would almost certainly skew higher. Typical colleges do not evaluate whether a student is “successful” by whether they have a 3.x first year GPA or a 3.y first year GPA. They instead focus on what happens after that. Students from less rigorous HSs often struggle in first year as they adjust to the more rigorous curriculum than they are used to. The important part is whether such students adjust to the more rigorous classes and successfully graduate with a decent GPA and post-college future, rather than their first year GPA. Consistent with above, the study also found that name of HS attended was far more predictive of first year GPA than was the student’s SAT score. Specific numbers are below.

SAT Score + GPA – Explains 20% of variation in first year college GPA
Above + Demographics – Explains 23% of variation in first year college GPA
Above + Name of HS – Explains 66% of variation in first year college GPA

This also raises questions about why name of HS adds so much to the prediction of first year GPA. I expect part of it is more rigorous HS classes generally leads to students being more prepared for first year college classes. In some cases, there is a good amount of overlap in content, such as first year classes in college repeating content from HS AP classes. I expect considering the HS name also gives context to the HS GPA. Achieving a 3.x HS GPA does not imply the same degree of achievement, across all HSs. Some particular HSs have more lenient/harsh grade distribution than others, as well offer a larger number of advanced classes than others. Looking at the full transcript in the context of the particular HS is more meaningful than just looking at HS GPA in isolation.

Now that some of the COVID test optional classes are have reached 4+ years, I expect we will see more information about what happened to such students beyond the first year.

1 Like

When it comes to engineering, I definitely wouldn’t want a student from Harvard or Yale with a 3.2. Cornell is a different matter.

I looked at the Opportunity Insights pdf that you posted because I was curious which universities the data came from. It said,

Ivy-Plus colleges are defined as the eight Ivy League colleges – Brown University, Columbia University, Cornell University, Dartmouth College, Harvard University, Princeton University, University of Pennsylvania, and Yale University – plus Stanford, MIT, Duke, and Chicago.

It made me wonder how many students are attending these specific universities who scored 1200-1300 on SAT? How many actual data points did they have for these SAT levels, compared to a presumably much higher number of data points for higher scoring students?

1 Like

Again, your prerogative to hire people who fit the criteria you are looking for.

3.2 would be a respectable GPA for a first year engineering student at UCB (as an example of a state flagship). Generally, lower div technical courses are curved or binned to a B- average. I don’t know about Ivy grading, though!

1 Like