Explaining majority of variance when HS effect was added wasn’t reviewed or discussed in the analysis, so it’s unclear whether there is a requirement of anything unethical to see a notable impact from considering this effect.
For example, perhaps a key driving factor for predicting first year GPA in college is rigor of HS classes. Both HS name and test scores are correlated with rigor of HS classes, so they show a notable correlation with first year GPA. It would not be unethical to consider rigor of HS classes as a factor in admission decisions.
Or perhaps it’s important to consider HS profile to give context for evaluating HS GPA. This could include things like considering whether a particular HS grades leniently or harshly in evaluating HS GPA, as well viewing HS GPA in context of HS course rigor. Again not unethical.
Or perhaps HS course rigor and context of GPA aren’t especially influential, and instead you need to do admit by HS name to see the bulk benefit. In this case, it would be unethical. Test scores have some correlation with HS name, so they can serve as partial substitute, without violating ethical boundaries. Given how powerful a predictor this is, it’s important to review and/or discuss.
I agree with what you wrote, which represent appropriate ways to use those factors in admissions, by using them in context to evaluate the strength of the student relative to opportunities.
But my point was that to make the high school itself a factor in admissions would be deeply unfair (leaving aside the reality that this is how feeder schools originally came into being).
I mean standard deviation, which tells us how much information this average gives us about the sample. The higher the standard deviation, the less information we can derive from the average. Since prediction is based on that information, variance is important.
Also, because the authors are generalizing this study and using it to predict the performance of future students, it becomes a sample, not the entire population.
Height is normally distributed, while grades are not. That makes a huge difference when calculating correlations and regressions.
The question isn’t whether it’s “everybody”. The question is whether 68% of the students getting 1500 have a 3.5-3.6 GPA, or whether that is only 5%. Moreover, if the distribution is skewed, the majority of students who got 1500 could have higher GPAs than the average, or if it is skewed in the opposite direction, the majority could have GPAs that are lower than the average. In either case, it points to a weaker relationship between GPA and SAT scores, and les predictive power.
My conclusion is that this study is flawed, because the results are too weak for the very definitive claims that are being made. This is based on their data, their modification of the data, and their analysis. It is based on the fact that they binned the data, which artificially reduces the variance, and artificially increases the explained variance in a regression.
Also, they wrote that they controlled for multiple factors, but are pretty opaque about how they controlled for these factors.
Finally, and most damning, is the fact they have not demonstrated the relationship between first year college GPA and graduation rate, or even cumulative GPA for all four years of college.
Their title is
Yet they only demonstrate the student’s performance in the first year (and even that is weak), while this title implies that SAT scores predict their grades throughout college.
If they are claiming that SAT scores predict college performance, they need to demonstrate a positive relationship between SAT scores, and college GPA, and, more importantly, between SAT scores and graduation rate, AFTER controlling for students who drop out for financial reasons.
And yes, students do drop out of these colleges for financial reasons, because financial aid cannot help students who need to drop out to work to support their family.
It is no surprise that higher level math courses have higher grade distributions than lower level math courses, since the higher level courses are more likely to be taken by those who are better in math.
This is why the score distribution for the AP Calc BC test is higher than that for AP Calc AB test, even though AP Calc BC course includes the AP Calc AB material as well.
Because many kids that shouldn’t take AP Calc take AP Calc thinking “well it’s not the hardest math so i’ll be fine!” even though they’re AVERAGE students and AP Calc AB is in my opinion, a class for above average students, just maybe ones that aren’t math geniuses…….
We see the same with AP Psych, which is known to be one of the easiest APs. Still, it has one of the highest (if not the highest) fail rates of all APs.
in my opinion this is so much of an issue that it deserves a thread of its own.
Not necessarily. Lots of schools only offer AP Calc BC so it’s not as if the students took AP Calc AB before or only the stronger math students take AP Calc BC since there is no other option for weaker students besides AP Statistics. In some of these same schools, there is a requirement to take the honors version of a science course before the AP so only students who did well in the Honors version of a science are allowed to take the AP version and yet the scores in these schools for the AP Calc BC for students who had no calc before still tend to trounce the AP scores for students with two years of study. AP Calc BC is just easy in comparison to most other AP STEM tests.
Incorrect. AP Physics 1 covers the SAME material as AP Physics C except the latter solves the problems with calculus rather than algebra. Ergo, many schools offer a joint class and you then take which test you want to take - so no many kids only take AP Physics 1 OR AP Physics C not both. Frankly, I am surprised at how many students on this board took both.
I know several and I am familiar with not that many schools so yes I expect this would be many. The schools are privates with small class sizes and do not have the faculty to teach both AP Calc courses or offer both AP Physics I and AP Physics C as separate courses in the same year.
Offering only BC for calculus seems to be uncommon these days, probably less common than offering only AB.
Also note that anyone getting to calculus in high school was placed on the +1 math track, so presumed to be “good” at math compared to the students on the regular track that ends with precalculus in 12th grade.
Small (and probably elite) private schools are not representative of high schools in general.
Not elite at all actually. One of the schools I am familiar with does place a kid or two into an Ivy on occasion but certainly not yearly - maybe one or two kids every five or more years? I don’t consider it elite but more elite than the others I am familiar with. The other schools have kids going to the local state schools which are not names you would find on a list of top 30 publics or anything of that sort.
I think people on these boards are so familiar with “feederish” high schools that they have no idea what many schools out there can offer their students due to budget constraints, teacher loads, student interest etc. As far as these kids being on a +1 track, sure but the same is true for the AP Calc AB students. These kids go directly from precalc into AP Calc BC or AP Stats. I guess the school could offer AP Calc AB instead but the kids who want calculus probably prefer the BC version so they can get more college credit. I don’t know how odd it is to offer BC instead of AB but of the schools that I know that offer only one of these courses, they ALL offer BC and BC only.
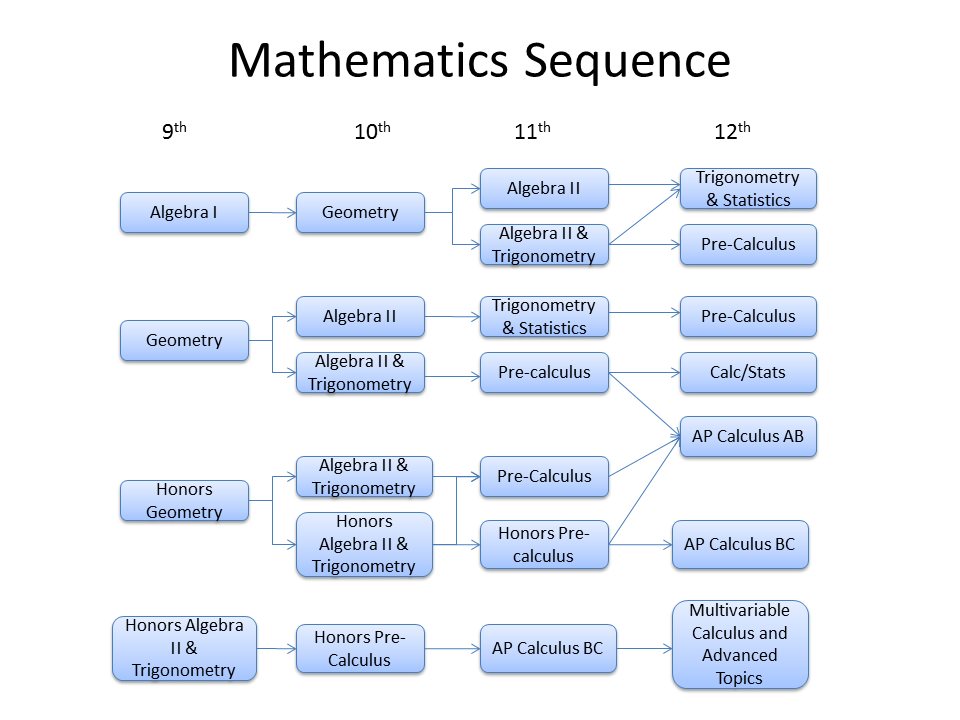
There are also often additional filters for AB vs BC . An example math track pathway sequence is below. In this example, BC calc requires being on the honors track and doing well in honors pre-calc. Students who are not on the honors track or do poorly in honors pre-calc instead take AB. The result is BC has a higher proportion of top math students than AB, contributing to why BC has a higher score distribution than AB.
Looking up my former HS (basic public HS in upstate NY), they use something similar. AB lists a prerequesite of pre-calc. BC lists a prerequisite of honors pre-calc. Students who are filtered for honors path generally take BC at my HS. Students who are filtered for non-honors path generally take AB at my HS. Yes, it’s not every high school, but the larger high schools with a larger number of students taking the exams are more likely to offer both, and a larger number of students taking exams has more of an influence on overall score distribution.
Yes That is far more the sequence I am familiar with than students first taking AP Calc AB then AP Calc BC though the schools I am talking about technically don’t have honors precalc but just precalc as the schools don’t have the student interest or funds to support both honors and regular. I expect the ones who don’t do well enough in the precalc course or don’t see a need for calculus take AP Stats but quite a few students will take AP Calc BC, not just the students who do really well in precalc. These students mostly score 4’s and 5’s on the AP Calc BC test and many of them don’t really study for their AP exams so you will see them get 3’s and even 2’s on other AP STEM tests. Sure this isn’t “proof” but based on their results, it’s rather clear that the AP Calc BC test is quite easy compared to the other AP stem exams as the number of 4’s and 5’s is not explained solely by only the good math students taking the exam. This bump in the AP Calc BC score is also not explained by a great teacher as the students attend different schools.
As for the topic, I think some schools may move toward allowing more test-flexibility rather than just requiring SAT scores such as allowing for AP scores since SAT testing sites aren’t widely available in some states like CA. I think this was Yale’s approach.
Not many. Perhaps " many small schools with most students going to college where a lot of those choose a 4-year college (directional or flagship - California excluded due to their 3-tier articulation.)"
Some schools do not offer Physics at all. Many do not offer AP Physics and fewer still offer AP Physics C.
The “choose your own math approach” model supposes 1) a school well-funded enough to have a high-quality Physics/Science teacher yet 2) small enough it can’t have one section of AP Physics 1 and AP Physics C, probably preferring this to an AP physics1 or Honors Physics model which would indicate a school with enough strong STEM students to even want such a class 3) students able to handle the math.
Yes I agree with this assessment so perhaps I should have said that of the schools that do offer AP Physics, there are schools that only offer a mixed AP Physics 1/AP Physics C course because there is not enough faculty to teach and/or students interested in these courses to offer both versions ever year. Many of the students who do take the AP Physics class are interested in engineering and most are not applying to elite schools though some might.
California excluded due to their 3-tier articulation - Not sure what this means. Can you explain why CA public schools would be excluded?
The 3-tier articulation is that right from the start CC/CSUs/UCs were thought in articulation and as complements.
As a result, nowadays, in California, attending a community college to later attend a UC can be a favorable choice for competitive students because the system was designed to make CCs parallel to UCs first years and some have become “flagship antechambers” of sorts. Therefore, the typical statistics about a HS, aka “% graduates who attend college including % 2-year, % 4-year” isn’t as intelligible a “shortcut” as elsewhere.
But typically you’d have basic info like “45% attend college, 35% 2-year, 10% 4-year” or “80% attend college, 60% 4-year, 20% 2-year” - sometimes with % joining the military, and, outside of CA, it gives you a first handle on the type of school (if you didn’t know it before).
For California, sometimes you know the HS and thus know students are attending CCs to transfer to a UC which is a different school profile induced by the three tier system& its evolution than in other states.
Thanks that makes sense! Is California that unique though as I thought there were similar community college to university pipelines in NY and other states?
Fine. My kids technically took Honors Physics before C. It doesn’t change the fact that there is a whole lot more self selection into Physics C that Physics 1. And btw, my S then took it a third time when he got to college, where his 5 was not accepted as equivalent. The class was still challenging enough to be interesting and require some degree of work.
At our school, going straight into C is possible but not advised. The kids I know who tried it were superstars and still dropped out. Same with the college situation. Technically the same class but the pace is depth and too great without prior understanding of the material.