The Misguided War on the SAT

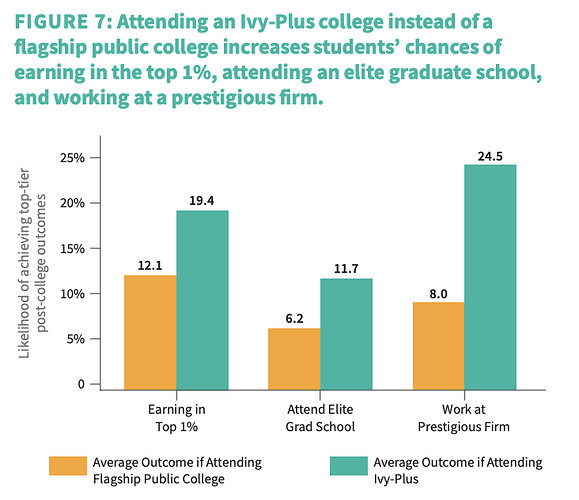
This is an interesting point. If we believe Dale and Kreuger, then no one is “losing out” by going down to #20. (yes, URMs are affected but I think that question is more complex than I want to go into here). But the Chetty paper (Oct 2023) has the following graph:

I’m focussed on the category on the left: Earning in top 1%.

What is the source of this difference? (the study just looked at people coming off, or not coming off, of waitlists to attempt to create an apples-to-apples comparison. Different than Dale&Kreuger) Is this a legitimate counter to the previous study?

Why do you think the recruited athlete isn’t also a scientist? Especially at SLACs.

4 Likes

The Chetty study you are referring to explicitly states that their findings are “fully consistent” with Dale & Kreuger. They state,

“However, once again, we find very small impacts of attending an Ivy-Plus on average earnings, consistent with the findings of Dale and Krueger (2002) who only estimated impacts on average earnings”

Note that you are referencing a difference in portion earning top 1% ($400k/year). That’s different from the average/median earnings that Dale & Krueger discuss.

One of the categories you mention is portion working at prestigious firms. The study defines prestigious firms as firms that employ a disproportionately large number of Ivy+ grads. This makes the finding is essentially that Ivy+ grads are more likely to work for firms that employ a lot of Ivy+ grads – a circular definition.

It’s a similar type of idea for elite grad schools. Elite grad schools is defined as Ivy+ or one of 4 publics, so there is a home school bias. I was among the ~1/3 of Stanford students that did a co-terminal masters degree, so I count as attending an elite grad school. Attending Stanford for undergrad no doubt increased chance of doing a co-terminal masters at Stanford and obtaining a grad degree. One of my relatives also majored in engineering, but attended GeorgiaTech rather than Stanford. He also continued at his undergrad colllege for grad school, obtaining his PhD at GeorgiaTech. He does not count as attending an elite grad school since GeorgiaTech is not an Ivy+ (or one of the 4 publics). The home school bias was a factor for both of us, and both of us attended what is likely the highest ranked college in our grad field, but only I count as having attended an elite grad school.

The final category I find more interesting – portion earning a .>$400k income. My guess is it relates to the “elite” finance/consulting connection. Comparing surveys of entering freshmen and graduating seniors at Harvard, far more students choose to work in finance/consulting than they had planned as freshmen. In the most recent senior survey, 41% said they were going to work in finance/consulting after graduating. Attending Harvard seems to increase chance that a student will change career plans and switch to finance/consulting, more so than attending other colleges. This change also likely increases chance of having a >$400k/year income at age 33.

It’s also worthwhile to note that Chetty is cherry picking to state as large a benefit of attending an Ivy+ college as possible. The point of the study is to show that top 1% kids have an advantage. Showing that top 1% kids have an admissions advantage means more if he can also show that there is a objective external benefit to being admitted to Ivy+ over peer colleges, so he emphasizes 3 measures that show as large a difference as possible. For example, he chooses portion with top 1% income at age 33 rather than average income (little difference) or at other ages (little difference in top 1% prior to age 32).

1 Like

Of course they might be! Those aren’t mutually exclusive. In any case the conversation has gone far afield. One minute we’re talking SAT and the next it is athletics. At the end of the day the American system is what it is. I think some of these issues have gotten more attention in the wake of the SC decision.

1 Like

Please move back to the OP which is about the SAT, not athletics.

4 Likes

Nor college rankings, nor education in Russia, etc.

I enjoy stream of consciousness as much as the next person, but in a thread such as this, it does make it difficult for users to follow.

1 Like

I guess the point you’re highlighting - and Chetty indicates - is that data from both studies, when using the lens that D&K used, result in the average income staying relatively unchanged by attending an Ivy+ school. And the point Chetty was highlighting, for the reasons you mentioned, is that “students who choose to attend IvyPlus colleges instead of state flagship colleges… are significantly more likely to reach the top 1% of the income distribution” [quotation from the paper]. I think this makes the layman’s “takeaway message” different between the two papers.

In the income category, your argument regarding the finance/consulting connection makes good sense. That sector’s recruiting seems to rely on “prestige” way more than most. But I fear this will be enough. I do believe that Chetty’s point is going to be anxiously referenced by many families facing the college admission dilemma, adding to the Ivy+ frenzy. And given the changing tide indicated by the NYT article, test score/prep frenzy as well. (Btw, I did catch the circular reasoning of the two other categories so chose to ignore them; I only included them in the graph for neatness, i.e. I didn’t want to just show a portion of the graph. I focussed on the income category because of this).

Regarding SAT’s predictive powers, I find the the Appendix from Brown/Dartmouth research (Friedman et al) persuasive. I wonder if small schools (Bowdoin, Bates, etc and perhaps Caltech) may just utilize less high stakes timed testing (in their classrooms) than the Ivy+ schools, and hence get different results, as they are the usual suspects who have data to counter Friedman’s. (And UCs basically ignored their research so they can’t be used as an example of large schools where SATs don’t correlate to college grades).

Or the study was flawed . . .

https://cshe.berkeley.edu/publications/satact-scores-high-school-gpa-and-problem-omitted-variable-bias-why-uc-taskforce’s

Point taken.

It still appears the conclusion warrants study since UCLA’s Gary Clark has recommended (via podcast) that people submit their AP scores if available as it helps the admissions office. It seems there is a void of some importance in the UC application, at least for UCLA.

Perhaps a discussion between Deming and Geiser would be a fun event although the result might just be that the institutions being studied just produces different data.

Not exacty.
They have received better guidance and understand admissions at their choice institutions. They get a feel for where they will end up with prep - and realize scores will not be helpful to their application. And they can still apply ED and test optional to a number of schools that people will think are prestigious and they will be proud of. Wealthier kids can do that easier and better for a variety of reasons.

2 Likes

Not sure I follow. I am not surprised he would recommend submission of AP scores, especially given that UCs give weight to AP courses. But AP scores aren’t an SAT score substitute. AP scores would likely be helpful to admissions officers even if SAT/ACTs were required.

1 Like

You’ve linked this twice as suggesting the original study was flawed, so I wanted to respond to it.

As a former quant, I used regression all the time. Linear regression is a very useful tool, as useful as a drill for someone doing woodworking. One of its advantages is that once a person understands the limits of the method, it is very easy to use, computationally fast, and quite often provides useful information.

But just as you need more than a drill to do woodworking, you need more than linear regression to perform analysis. In woodworking sometimes you need a drill, but other times you need a hammer, saw, chisel, screwdriver, clamp, etc.

Saul Geiser’s response talks about omitted variable bias. He runs a regression that suggests that adding student demographics makes HSGPA a more powerful predictor than SAT/ACT scores. Note that he doesn’t say that the effects of the SAT go to zero, just that the HSGPA becomes a stronger predictor than SAT/ACT scores. In fact, after adding high school demographics, both have a strong predictive effect.

One of the key limitations of linear regression is that it assumes that it assumes linearity, and very often the world doesn’t work that way. In the real world, practitioners will look at what linear regression suggests and use other tools to verify what it is suggesting. But quite often academics don’t do that, and that’s apparent for those that have read a lot of academic papers.

What I liked about the STTF report is that they didn’t stop at just linear regression. They also looked at the interaction of SAT scores and GPA visually, using a number of controls that are related to student demographics, including race and income before coming to their conclusions. Here is one such example from the report.

7 Likes

For a school utilizing a test blind philosophy to consider a different test I think says something. Yes really it’s an ACT/SAT blind policy, and ACT/SAT are not AP tests, but AP shows a correlation with wealth as well. Without going into which is a better measure, using AP scores (and Emory does this as well and stated it helps in dealing with grade inflation) indicates that there’s useful information to be had. The UCLA admissions office is certainly not taking the “don’t send us more than we asked for” stance nor the stance I’ve seen at many colleges which is that they even look at AP scores if sent for admission (eg Whitman)

The problem I think they are trying to solve is how to compare GPA/performance across schools (and teachers/classes) when the landscape is shifting. They can rely on school profiles and reputation only so much.

1 Like

Geiser’s critique seems to be, essentially, that if you include family income, parental education, and race/ethnicity in the model, then the predictiveness of ACT/SAT declines (but apparently doesn’t disappear).

I presume that ACT/SAT is positively correlated with parental income and education, and with white/Asian race.

So, for his point to really come to bear (i.e. we should use these OTHER variables and de-emphasize or even ignore ACT/SAT), then you’d have to have the UCs giving admission hooks to rich, white/asian kids of highly educated parents.

The notion that the UCs would (or should) do that is laughable.

(H/T to someone on Twitter (reposted by Megan McArdle, IIRC) who made similar points about a similar analysis.)

1 Like

It’s often assumed that the UC report recommended keeping the SAT. It didn’t. The authors of STTF report instead recommended replacing the SAT with a new assessment system, as quoted below.

Recommendation 6. Develop a new assessment system that will be continuously accessible to students and that will assess a broader array of student learning and capabilities than any of the currently available tests.

The authors of the report had different opinions about whether UC should wait until the new assessment is available before going test blind, or go test blind before the new system is available, as quoted below.

Members of the Task Force differed on the question of whether to recommend that UC cease consideration of standardized test scores sooner — in all likelihood before availability of the replacement suite of assessments.

When COVID happened UC decided to go test blind sooner, which I don’t consider inconsistent with the report. What is inconsistent, is I am not aware of any plans to implement a new assessment system to replace the SAT.

.

Also note that there are no schools I am aware of that found SAT doesn’t correlate with college grades. It does. For test optional, the more relevant question is what SAT adds beyond the criteria that would be used to admit test optional applicants. This criteria is more than just looking at average HS GPA in isolation, without considering grade distribution of HS, which courses are taken (rigor), which courses have higher/lower grades and relevance to major, LORs, ECs, awards, …

For example, prior to going test optional Ithaca’s review found the following portion of variance explained with different combinations of application criteria. SAT had a fairly decent ~0.5 correlation with cumulative GPA (section correlation ranged from 0.29 to 0.42), yet when SAT was removed, there was little loss in explanatory power because that ~0.5 correlation was overlapped in other available application material.

HS GPA + SAT + Rigor + AP hours + Demographics + … – Explains 44% of variance in cumulative GPA
All of Above with SAT Removed – Explains 43% of variance in cumulative GPA

Of course Ithaca is not the same as MIT, Caltech, or Ivy+ colleges for a variety of reasons including different degree of ceiling effects, different major distribution, different rigor of college classes, different goals in creating class, different measures of success, … What works for one college is not necessarily the best solution for a different college.
3 Likes

This IMO is the same red herring driving much of this discussion. Who said the effects of the SAT were zero? The question, in my opinion, is whether the benefits of requiring the tests are worth the costs. The article in question ignores the costs. As does almost all the analysis.


There is a popular misconception (expressed numerous times in this thread) that those who are okay with TO or Test Blind admissions at some universities are automatically against all testing in every situation. That’s false.

1 Like

"For example, prior to going test optional Ithaca’s review found the following portion of variance explained with different combinations of application criteria. SAT had a fairly decent ~0.5 correlation with cumulative GPA (section correlation ranged from 0.29 to 0.42), yet when SAT was removed, there was little loss in explanatory power because that ~0.5 correlation was overlapped in other available application material.

HS GPA + SAT + Rigor + AP hours + Demographics + … – Explains 44% of variance in cumulative GPA
All of Above with SAT Removed – Explains 43% of variance in cumulative GPA"

And again, one presumes that the direction of explanation for demographics->college GPA is a positive correlation with wealthy kids of highly educated white/Asian parents. So, NO, Ithaca and other colleges will likely NOT be including demographics in that way in their admissions (positive hooks for those kids).

AP hours is another one that, while likely (strongly) positively correlated with college success, has limited usage in practice for admissions, because AP classes offered again likely correlate with rich/white or Asian/highly educated parents.

I don’t disagree; wealthier kids do receive better guidance and can assess their odds of admission with/out scores. AND for those who were already inclined to cut corners–which is by no means all affluent students, but there are definitely some–test optional policies eliminate a barrier to entry that those students previously had to take seriously. Then can redeploy their time to the multitude of other resume-building activities that advantage rich(er) kids. My point is that for kids for whom much comes easy, testing was a roll-up-your-sleeves and get-the-job-done event.

Demographics in isolation explained 8% of variance in cumulative GPA. The bulk of this 8% relates gender demographics, rather than race demographics. Race (defined as ALANA or not-ALANA, which is essentially non-White or White) had a relatively small correlation with income.

It’s not as clear how Ithaca uses demographics in admission decision. The report makes it sound like a key goal of the test optional policy is to increase the enrollment of ALANA (non-White) students. Their target was 15% → 20%. The actual results were as follows. The test optional group was more diverse and had more low income students, yet had similar cumulative GPA and graduation rate to test submitters.

Test Optional Applicants – 40% ALANA, 17% Pell
Test Submitter Applicants – 26% ALANA, 10% Pell

Test Optional Enrolled – 31% ALANA, 30% Pell
Test Submitter Enrolled – 19% ALANA, 18% Pell

Test Optional Cumulative GPA at Ithaca – 2.83
Test Submitter Cumulative GPA at Ithaca – 2.86

Test Optional Graduation Rate – 63.3%
Test Submitter Graduation Rate – 63.9%


The motivation I was trying to point out is the desire to move away from criteria that are correlated with wealth/privilege. That exists at just about every school. But a small percentage want to take it to the level of being test blind like UCLA. Given the rhetoric on this topic, outside of this thread mind you, a large motivation for going test-blind was increasing access and the removing the biases associated with the SAT/ACT. I find it contrary to that motivation to then utilize AP scores that also correlate with wealth/privilege.

As to the outside rhetoric, Jon Boeckenstedt has toiled tirelessly against the SAT and is often hailed as one of the vocal anti-testing champions. He writes “HS GPA is really all that has ever mattered” I’d wager he’d put AP scores in the “doesn’t matter” bin as well.