Yes. Upenn prefers ED really.
So a lot of people apply to Penn from our feederish HS, and as a result we actually have a pretty decent dataset I can break down by ED versus RD.
The raw ED admission rate is 30%, RD is 11%, so that is your normal sort of thing that convinces some people that applying ED must be a big boost.
But then the average stats for the ED admits are a 4.01 (out of 4.33) GPA, 1518/33 (SAT/ACT), and for the RD admits it is 4.03, 1513/32. This is the sort of data you do not normally get, and it immediately calls into question the idea ED is helping people with more more marginal qualifications get admitted.
If you look at the scattergrams, you can see what is happening. Way more people who are not really close to being competitive apply RD, so that is driving down the RD admit rate. This is consistent with there being a high bar to “wasting” your 1 ED slot on an extreme reach, but being OK with giving 1 of your 20+ RD slots to a few such extreme reaches.
Of course this is not a full blown predictive model with all the necessary controls, but it is this sort of thing which makes me skeptical applying ED really helps a lot of people get admitted who would not get admitted RD anyway. At least not from feederish high schools like ours.
7 Likes
My D24’s school, also a Penn feeder, has results (in Scoir for the past 4 years) showing a different trend:
ED:
RD:
1 Like
Interesting that y’all’s Scoir accounts let you see ED vs. RD. Mine doesn’t!
That is a new feature released just recently. It allows you to access more data than the scattergram.
1 Like
Oh, wow! I see how to get to it now. Thanks so much!
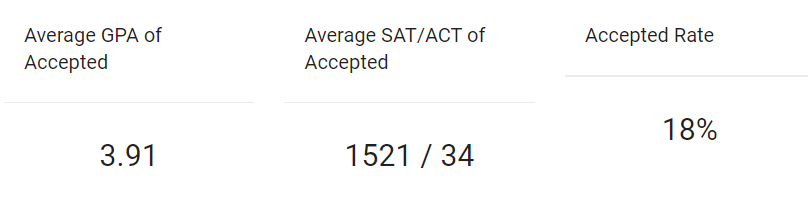
Ours defaults to 7 years, so I changed it to 4 years:
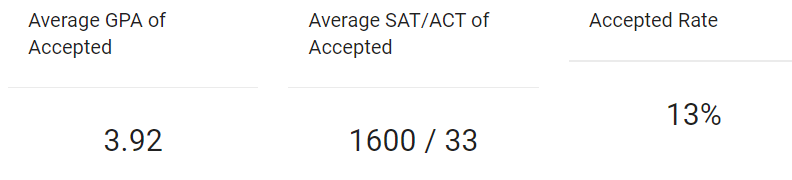
ED: 4.10, 1555/35, 27%
RD: 4.04, 1507/32, 12%
So, even worse of a discrepancy between our results!
That’s very interesting to me. Could be a fluke, but could be a difference based on some Penn practices that work out differently for different high schools.
So the sampling sets from all of us are not large enough.
Not for anything scientific, but then again the raw ED/RD acceptance rates people compare are not really comparable “samples” either. They are what I would call a census, and they are taken of two different populations, and none of that really directly answers the hypothetical question of what would happen if an individual applicant moved from one population to the other.
By the way, for the record the 4-year ED set was 11 applications, 4-year RD was 31, 7-year ED 30, and 7-year RD 61.
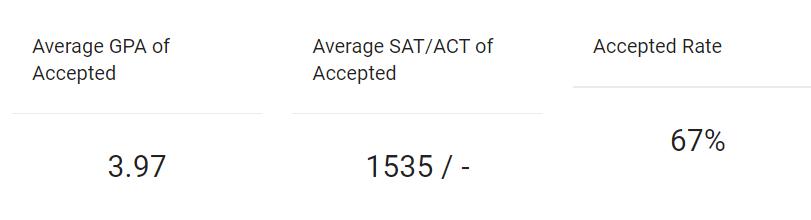
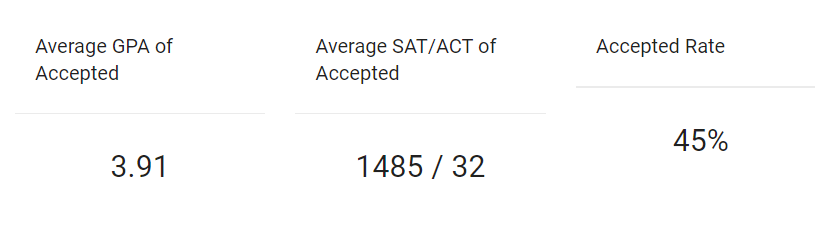
4-year for WUSTL:
ED: 10 apps, 3.93, 1480/34, 40%
RD: 39 apps, 3.99, 1461/31, 19%
By the way, I realized I do not fully understand how they are calculating the acceptance rate.
Like, for those 39 RD apps, the actual breakdown is 7 Accepted, 1 Accepted off the waitlist, 13 waitlisted outcome unknown, 1 Denied off the waitlist, 17 Denied.
7/39 is 18%. 8/39 is 20.5%. 19% of 39 is 7.4. Did they actually count the one person Accepted off the waitlist as a half? That would be assuming to me if so. And I also wonder about those 13 unknown waitlistings, but OK.
It seems that WashU is much less friendly to my D24’s school because we had far less people applying to WashU…
Let’s see, going all the way back to Penn RD 7-year:
31 Apps, 3 Accepted, 1 Accepted waitlist, 4 waitlist unknown, 23 Denied.
3/31 is 9.7%, 4/31 is 12.9%, 11% of 31 is 3.4 . . . so yes, looks like being Accepted off the waitlist counts as a half acceptance. Definitely amusing to me.
1 Like
We discussed this a bit in the WUSTL thread and I am very sure you are right. SCOIR doesn’t have this information reported to parents, but I know some of our kids actually then go to WUSTL as well. And I think all that very obviously helps our applicants get accepted at a higher rate overall. Indeed, it could be as “simple” as some yield model scoring our competitive kids relatively highly in terms of yield prospects.
Edit: And just to elaborate a bit, the most logical reason a college would actually favor ED for unhooked applicants would be if they considered that preference to be a valuable yield tool. But they don’t really need that if RD is very predictable–then they just know they need to admit 3 or 4 or 5 or whatever people RD for each slot they want to fill RD. But if RD yield is not so predictable, then they might find a preference for ED helps stabilize their yield models.
The “fun” thing we might be stumbling into here is there is no particular reason to believe they have to do this pool-wide. Like, at least hypothetically, Penn and WUSTL could see RD yield as very predictable for applicants from our HS, which would help explain why there does not appear to be much if any ED preference among those colleges for our applicants. But they could see it very differently when it came to the RD yield of applicants from some other HS, even if broadly speaking they were similar sorts of schools
So . . . yeah, this is a real mess. I guess if you have SCOIR or similar available and even a decent number of data points, try to get some insight from that. But if the presence or absence of an ED preference can depend on the school, and you don’t have that data? Very hard to know what if any help you will actually get by applying ED.
2 Likes
our school does not have nearly as many apply to ivies in general so there was very little naviance data for most ivies but the few who have data, and other T10 non-ivies, , its similar to what you say, the stats are not that different (there is a slight difference for some, as in gpa half a decile lower on avg for ED vs RD, and pre-TO SATs 30 points lower ED for RD) and in some cases zero difference, just less apps ED than RD, and less wild-herring hats thrown in from the middle of the class. Also hooks vs not is knowable so that helps.
1 Like
For the Scoir data you guys are displaying are those unweighted or weighted gpas?
So would it be correct to think that someone deferred in the ED round would have a better shot in the RD round? Assuming that their stats and such weren’t enough to get an ED acceptance but also they were enough to not get rejected…so essentially competitive
Our HS uses a 4.33 system, but it is not weighted.
1 Like
So the best information I know of about deferral at Penn is in this document:
This was for the Class of 2025, and Penn reported a 9.5% acceptance rate for deferred candidates. I believe that the overall RD acceptance rate for Penn 2026 was 4.2%. So that would imply deferrals were admitted at over twice the rate of ordinary RD applicants.
Edit: Actually played with the URL and found the Class of 2026 version, in which it was 10% versus 4.99%:
1 Like
That’s interesting thanks for the info! D24 ED’d there and was deferred. It seems like such a long time ago and now we are less than a week away from hearing from them again. What a long road we’ve been on ![]()
2 Likes