Will Non-Merit Giving Selective LACs Need to Change to Attract High-Income Students?

To my knowledge they never release this sort of data these days, but I agree your guess is a good one.

But isn’t that the primary answer to your original question? If these colleges are still getting a high volume of applicants from higher-income families, many of the applicants with very high test scores and other highly competitive qualifications, and their yield is decent among the ones they admit, then they have all the applications they need to get as many such students as they want.

Again, I think the actual answer to your original question is that some are in fact tweaking some aid policies and such to compete for such students sometimes, but really around the margins. The big picture is even if there are some higher-income parents vocally declaring they are unwilling to pay these prices, there are still apparently plenty of other families willing to send their kids to such colleges on those terms.

So much so that THEIR most common complaint is that their “average excellent” kids and such might have to “settle” for a private (or OOS public) that is just a bit less selective (but still very selective) than they were hoping. Implying the main scarcity in such circles is still much more on the supply side than the demand side.

This is the crux of the question, and I suspect the answer is that the yield in that income band is lower than most.

I read the question as, “Do you need to change to attract the next level of income versus the top 1%?” The unadjusted chart says you’re doing just fine with extreme over-representation at the 1% and over-representation at the next 10% and on down. The adjusted chart shows that actually that next 10% down is making a bigger financial choice to go elsewhere.

Take a look at a high-quality, but not “tippy top” public like Rutgers.

Here, we can see that at the highest incomes, they’re not selecting Rutgers given an equivalent SAT score. The SAT score adjustment, I think, is important here. It starts to indicate that higher incomes will make a choice to go elsewhere (I’d guess private, but you couldn’t specifically say given the data). They have options that aren’t just the most selective colleges, but a whole slew of relatively expensive privates.

The other thing that’s interesting is that now that next 10% is over-represented here. The cost is important and given that they could choose between Rutgers and maybe a comparable private (not the most selective, but let’s say a tier or two down) that they’re choosing the less expensive option.

If I take what might be a comparably selective school to Rutgers, Brandeis, we can see the opposite effect.

Here, like our other selective LACs, we get the dip at the higher, but not highest, income.

Of course, if we look at Brandeis without the SAT adjustment, then we get the normal hockey stick again.

Sorry, we’ve gotten off of LACs for a moment, because I couldn’t find good comps for the next level selective LAC, so hope this isn’t throwing things off. But I think the important element to me is that if you’re a next level down in selectivity where folks have good in-state (read: cheaper) options, then you’re going to lose them at a higher rate and thus become more barbelled.

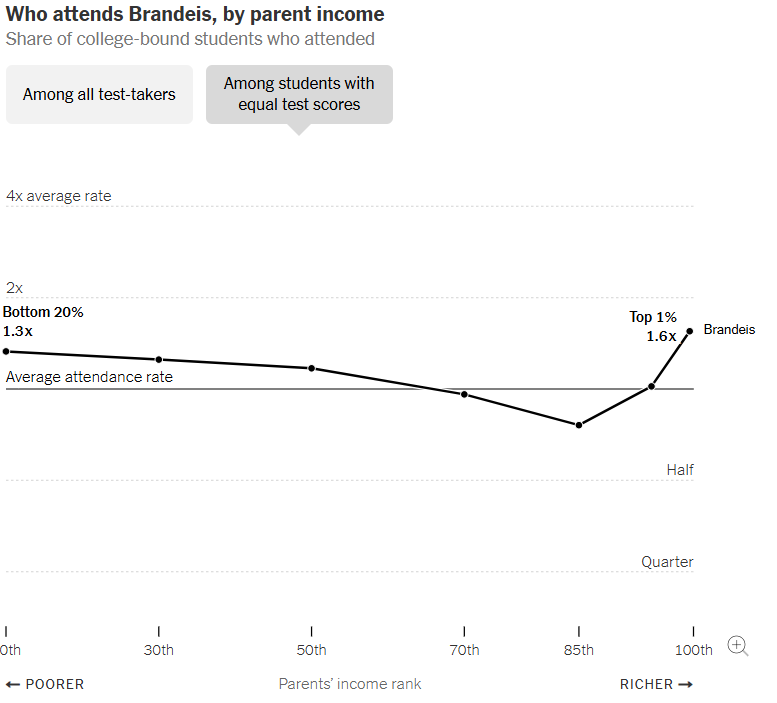
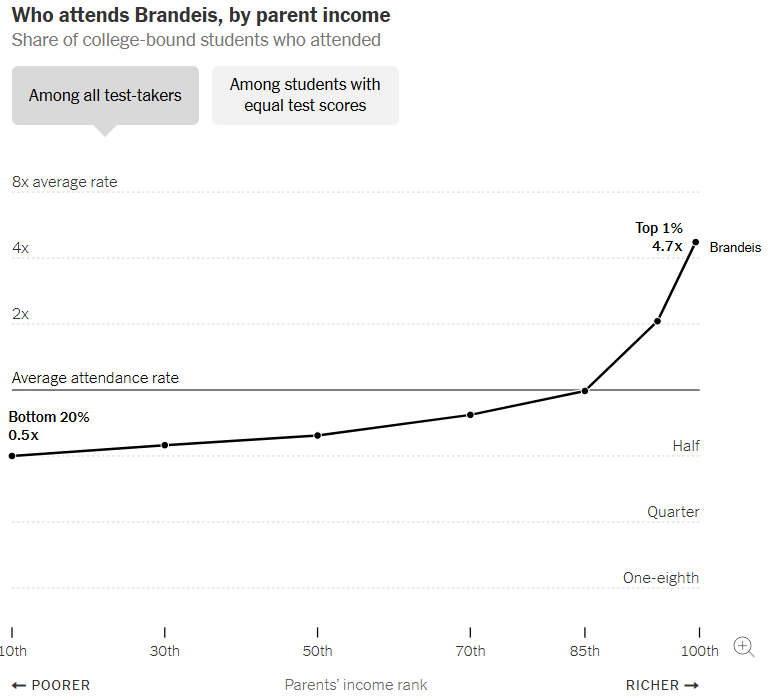
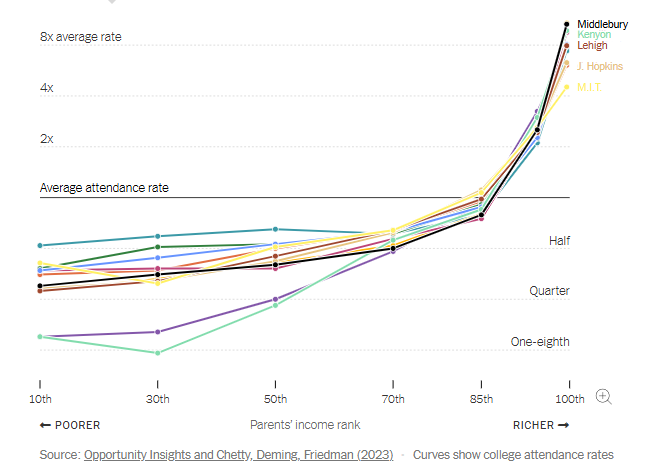
So at least as of the time of that study the NYT is relying on, this was not happening, as indicated by the graphs. Adjusting between time periods is tricky, but $200K of household income in 2024 was about 85th, $600K just shy of 99th. That was the “blade” of the hockey stick, meaning Harvard, these LACs, and so on were typically enrolling disproportionately large, not small, percentages from those income ranges.

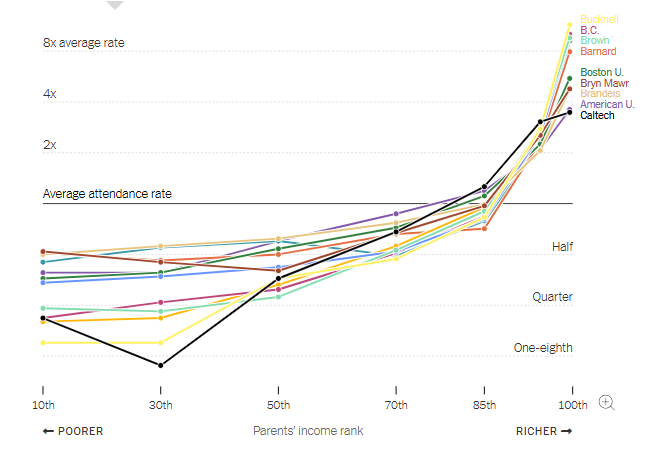
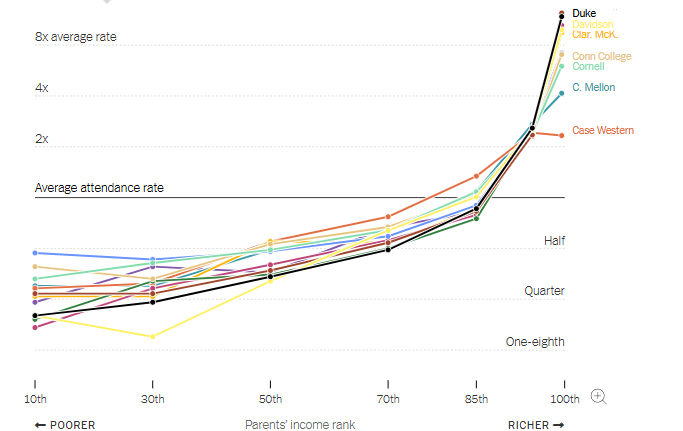
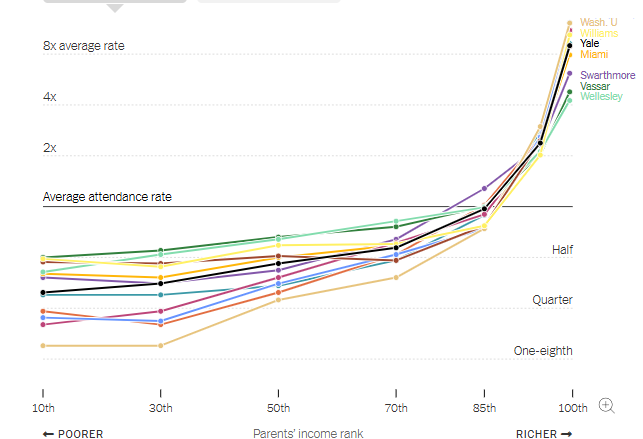
Like here is Oberlin, say:

Imgur

At that time, at least, no obvious problem enrolling in the 85 and up range.

I am not aware of a similar study conducted with data from the last few years, so possibly things have changed. But that said, in terms of anecdotes, our S24 attended a private HS with a lot of families in that range, and many ended up sending their kids full pay to privates–including us. Not that no one chases merit or goes in-state, but many do not end up making one of those choices.

I don’t think this means my experience is more typical and yours more atypical. I think instead the norms around all this vary a lot in different schools, communities, states, and so on. In fact, rationally factors like the cost and nature of your in-state options should be relevant. So too maybe the degree to which, say, local housing costs mean more or less savings goes into home equity versus something like a 529. And so on.

So I live in a state where the flagships are considered very good but not like the top UCs or Michigan or Texas or such. And housing costs in our metro have been relatively modest by coastal standards. So I think it is just sort of normal in our circles for higher-income professional families to save a lot in 529s and such, and then pay that out when it comes time for college.

Again, that doesn’t mean that is the dynamic everywhere. But the question for the colleges is whether it is normal enough among enough families with enough highly competitive applicants that they still get far more such applicants than they need to enroll as many as they want.

And my two cents is even without the really detailed enrollment data, everything else we know about the current application dynamic suggests yes, they are not hurting for highly qualified applicants from higher income families.

My guess is yield likely goes down with family income because those families are more likely to have applied to and gotten offers from competing institutions. Legacies and such might cause some noise but I would guess that is the primary relationship.

But that doesn’t really matter if they get enough applicants. Like if their average yield is 25% and it is only 20% in this group, but they get so many applicants in this group that their acceptance rate for that group could be 4% at 25% yield, then they just have to make it 5% at 20% yield to enroll the same number of students from this group.

4 Likes

Genuine question, what counts as “typical assets”? (Given how, despite the very recent dip and a couple of earlier ones, the stock market has had a crazy run for years now.)

1 Like

I think typical assets usually include any non-retirement savings and investments (cash, investment accounts, bank accounts etc), some % of home equity,value of business, real estate (i.e. second home or rental properties). What the value of typical assets should be to qualify for aid will vary (i.e. if you have more than “X” amount you won’t qualify or will qualify for less).

I guess we’ll have to stop debating this point, but I will just underscore you just talked about that chart as if it was unadjusted for test scores!

In fact the authors of that study suggest something quite different (their discussion is about admissions), which is actually consistent with what the schools themselves have said on many occasions. What the colleges say is happening is they evaluate test scores and other such qualifications in context, such that if, say, you come from a bottom 10th family and yet have a 1500 SAT, they see that as significantly more helpful to your application than if you come from a top 10th family with a 1500 SAT. But then somehow the very wealthiest families “overcome” this “problem”, which is what really concerned Chetty et al.

Anyway, the adjusted chart reflects that if you happen to be such a high test score applicant from a lower income family, you are more likely to have the choice to attend Harvard, which makes sense because they are more likely to admit you, at least all else equal.

But then none of this data says anything about whether people from higher income families with such high test scores are actually less likely to accept a Harvard offer, as opposed to just being somewhat less likely to get a Harvard offer in the first place.

And that is because Harvard got so many such applicants to begin with–high test scores and such from high income families–it could reject disproportionately many and still enroll all it wanted. At least back then.

Again, to me you are talking here as if you were looking at the unadjusted chart.

You showed yourself that Brandeis was not actually becoming barbelled at all!

The comparison between those charts actually implies is that Brandeis was getting SO many applicants with higher test scores from higher income families, it could afford to select them less frequently and still avoid getting barbelled when it came to actual enrollment.

Yes, it was a rough value of “X” was that I was interested in. In other words if say $200-300k is the income cutoff for aid, what kind of asset value would they “typically” expect to see for that family? Given different exposures to stock markets and wildly varying house prices, for example.

Not sure that is transparent. What I did to try and see if I could figure it out is run the npc with multiple different numbers. It didn’t make a difference for us so I don’t remember the details

1 Like

I’ve never bothered to do this, but if you wanted you could sit down with the charts that some colleges have published plus their NPCs and figure out what sort of assets they must mean.

Like here is Yale’s version:

https://admissions.yale.edu/affordability-details

You could do something like go to their NPC, put in say the midpoint of one of the listed income ranges, then play around with the asset values until you got around the listed numbers.

Yep - no debate so I’ll stop here. But, it’s enrollment data, not admissions, for what it’s worth.

image

They don’t publish that information, unfortunately.

And since we are now agreeing not debating, hopefully this is helpful additional information.

If you look at the paper in question, these were part of a series of figures presented in the Figures and Appendix Figures, and they do attendance rates, then application rates, then attendance rates conditional on application rates, and finally matriculation rates (and at that time at least there was no notable yield fall off with income, if anything the opposite).

Section 3.2 of the paper then discusses all this. The basic question of that section is:

We now decompose the differences in attendance rates by parental income conditional on test scores into the effects of application, admissions, and matriculation. How much does each of these margins contribute to the additional 168 students from the top 1%? This diagnostic analysis helps identify at what point in the process socioeconomic gaps in attendance emerge and what types of policies might address them.

Executive summary, they find different patterns for different types of colleges, but for the Ivy Plus colleges that concern them:

Since Ivy-Plus application rates do not exhibit the same spike at the top of the income distribution that attendance rates do, the gradient in attendance rates must be driven by differences in attendance rates among those who apply to Ivy-Plus colleges. Figure 3b confirms that this is indeed the case. Attendance conditional on application rises sharply in the upper tail of the income distribution at Ivy-Plus and other highly selective private colleges

As they point out:

The difference in conditional attendance rates must arise either from differences in admissions or matriculation rates.

They look at both and find a big effect in admission, very little in matriculation, particularly after controlling for round. So they conclude:

The preceding analysis suggests that differences in admissions—rather than application or matriculation—drive most of the gap in attendance rates by parental income at private institutions.

OK, so these charts the NYT promoted are sort of an intermediary step in this analysis, and controlling for test scores is being done to be able to later conclude it is higher admissions rates even controlling for test scores that is driving such high rates of very high income attendance at these colleges.

1 Like

Unless a family is comparing being full pay to a REAL free ride (including everything) saying $90K doesn’t make sense financially is technically incorrect. The comparison is between the kid’s merit award or your own state flagship, vs. the $90K. And for some (not all) of these families, the difference makes sense. If you live in Michigan or Virginia or one of the world class public U states- then sure, choose Michigan et al (as many of these high earning families do). But if you are Pennsylvania, for example, with a relatively high priced flagship U which may be geographically undesirable-- I can see why evaluating the difference between the cheaper public and the full freight school is a valid comparison. Even more so if the choice is an LAC which offers a totally different experience from Penn State.

I just don’t think you can state “90K doesn’t make sense financially”. For some families, even if it involves a whole lotta belt-tightening it’s a choice they are prepared to make.

9 Likes

But there are so many great LACs that do give merit, that provide similar educational experiences, and that definitely provide similar career outcomes. I can totally see preferring a LAC that doesn’t give merit. I imagine this is mainly due to rank/prestige or expectations set by community / family peer group, but also location and fit. I know some families choose to do so.

But I think, if we are talking purely objectively, it is fair to say that it doesn’t make economic sense to do so. (e.g., I think some kids would be better fits at Carleton than St. Olaf, but is the outcome for students at those two schools that are practically within earshot of one another worth the difference of over $200,000? I think, objectively, that would be a very hard argument to support. Or Bryn Mawr vs. Haverford. Within earshot. Similar schools (shared course catalog!). Huge price difference (if high income). Same outcome (obviously only for female students).

2 Likes

There are a lot of things in life that don’t make economic sense… but criticizing those choices is considered anti-social. Designer handbags, owning a boat which you use twice a summer when you could rent for 1/20th the cost, fancy cars which depreciate the minute you drive off the lot. Flying business class for a two hour flight. Staying at the Ritz when the Hampton Inn is much closer to where you need to be in the morning. Buying a time-share pretty much anywhere.

3 Likes

On the Harvard NPC, a family with $200k in income hits $0 in aid with assets = $1,065,450. If a family has been making $150k plus for a decade or two, with 15%-20% savings rate, $1MM is not very hard to reach.

I have a relative who has a child at a top private school paying $25k instead of $83k, with income > $150k, but never saved any money so no assets. It drives me nuts, since I have been saving for decades.

Our kids will be attending OOS public schools.

5 Likes

I think a lot of this depends on what you mean by words like “objective” and “economic”.

Four years at a residential college covers a lot of different things, so there are a lot of different economic categories it plausibly fits into.

Some people like to view it as a sort of capital investment where your return is supposed to be measured in terms of enhanced career earnings potential. Which can be one valid consideration. But college can also be seen as a type of consumption good, where some of the value is just the actual experience of going to college for its own sake. And then there are questions like how an education or college experience could have long term benefits even if they don’t show up in the form of higher career earnings.

Meanwhile, money is just a medium of exchange, so it isn’t actually a complete decision analysis to show you eventually make more money. The remaining question is what you then intend to do with that money. And one plausible answer is to buy nice things for yourself and your family, things that have inherent worth. If instead your answer is always just to invest in things that will make you and your family even more money in the future, you are never actually closing the loop.

OK, so this then becomes a multgenerational thing. Parents have good career earnings and want to buy nice things for their kids. To the extent they believe paying more for a college education could lead to a nicer experience and possibly some non-monetizable long-term benefits, that is not inherently irrational, it is potentially a way of actually doing something useful with their money.

Of course they have other options for nice things to buy, including other things you can upgrade. Nicer houses, nicer vacations, nicer meals, nicer clothes, whatever.

But if the bottom line is you are going to spend a good chunk of your money buying nicer things for yourself and your family, then a nicer college is not an inherently irrational thing to put on the list.

But like all such decisions, it is very personal, or subjective if you prefer. But when it comes to how to finally actually spend your money, doing so for subjective reasons is not inherently wrong, indeed it is basically unavoidable.

5 Likes

Graphs below show income distribution for the selective private colleges available in the earlier link. Nearly every highly selective private pattern seems to show a similar type of income distribution – the higher the income, the more likely kids are to attend. There seems to be almost no exceptions to this generalization regardless of the college’s FA policy, merit aid policy, need blind vs need aware, or degree of admission preference for low/high income students. I’m surprised by how consistent it is, as I’d expect there to at least be exceptions at some very small colleges due to small sample size.

The closest things to outliers are Caltech had significantly more 10th percentile income than 30th, and Case Western distribution didn’t increase from 95th percentile to max.


1 Like

However, public colleges show a very different pattern, particularly not super selective publics. There is often relatively little change in distribution across income, with the exception of top income kids. Top income kids are often underrepresented at publics, in spite of in-state public colleges often being less expensive that the selective private colleges that they do attend. Some example graphs are below.

It’s a similar idea for not-high income students at highly selective privates, as the majority of high achieving lower income do not apply to any highly selective private colleges, in spite of often costing less than the non-selective local colleges that they are more likely to attend. At many highly selective privates, less than ~50th percentile income corresponds to ~$0 cost to parents. A quote from the abstract athttps://www.nber.org/papers/w18586 is below.

“We show that the vast majority of very high-achieving students who are low-income do not apply to any selective college or university. This is despite the fact that selective institutions would often cost them less, owing to generous financial aid, than the resource-poor two-year and non-selective four-year institutions to which they actually apply.”

2 Likes