Someone actually does that where you can reset the weightings. I forget which one.
USNWR. Is this what you had in mind?
Foiled Again!
2 Likes
In my opinion, the bigger issue is lack of accuracy or meaning. For example, the highest weighted criteria at 33% is salary impact. It sounds like the expected salary is based on a combination of standardized test scores and location. For example, if the school is has an average SAT score of 1500 and is located in NYC, a high salary is expected. If the school has an average SAT of 1000 and is located in rural Kentucky, a lower salary is expected. The score is based on whether the college beats salary estimate or not.
It doesn’t sound like they consider things like major distribution or desired field of employment of grads, in salary expectations. This means that tech colleges or others with a higher % CS or finance will get a boost, while LACs without large CS/engineering share may get a penalty.
I expect this contributes to some of the more surprising schools in the overall ranking, like Babson at #2. I can’t see much of anything on the WSJ site with everything being paywalled, but Payscale puts Babson’s grads median salary among the top 5 colleges in the US – roughly tied with Harvey Mudd. This is far higher than typical for colleges with Babson’s average SAT, which primarily relates to the distorted major distribution from the college only offering a single major in business administration (different concentrations within that major are available).
I could write similar criticisms of most of the other ranking criteria.
5 Likes
I have a Babson bias, but also have an ROI bias - so maybe it all makes sense.
It can be hard for people to see new winners, but if the data supports it… fine with me.
3 Likes
It is not hard to see new winners (and I do think highly of Babson). I just don’t happen to agree with a ranking methodology that claims to find the “best college” yet gives 70% weight to one factor (ROI in this case). YMMV
1 Like
Working backwards IMO to fit a narrative. I was once a fan, but have become quite the opposite.
1 Like
If I understand correctly, student outcomes = 70% of the rating and subsequent ranking of each school is based on estimates made by the WSJ staff which account for 33% (salary impact) and 17% (years to pay off net price). So 50% of the 70% is based on estimates by the WSJ staff.
The WSJ loses its credibility on this one.
4 Likes
Have you read their methodology? This is truly an RoI ranking. It is particularly useful for those who need financial aid or merit aid.
In fact, I’d say the findings echo much of what I’ve learned here and on other boards and CDSs over the years.
1 Like
Trying to predict which colleges have the best ROI by looking at a internet college ranking is a foolish exercise The numerator of the ROI is not primarily determined by college name. More influential are things like planned major + desired career path, and individual student factors, such as being high achieving and highly motivated. None of this is considered in the ranking beyond looking at average test scores, so the ranking instead favors colleges where the average student at the college better meets this description – more likely to choose a major/career associated with a higher salary, more likely to be high achieving, more likely to be highly motivated. Attending a college where the average student is more likely to choose a high paying major/career or more likely to be high achieving/motivated does not mean it will increases your chance of choosing a high paying major/career or increase your chances of being high achieving/motivated. You don’t suddenly become the average student at the college you attend, which is used for the ranking.
Similarly the denominator of ROI varies wildly among students who need FA + merit aid. For many students who need FA that denominator could be ~$0 at HYPSM… or could be over $100k (across 4 years) at other schools. For students who need merit aid, there are similar degree of fluctuations. Attending a particular college doesn’t mean your cost suddenly becomes the average cost for students at that college which is used in the ranking. As an example, the average costs from CollegeScorecard which I expect (says average cost for FA recipients, behind paywall so can’t confirm) are used in the ranking are below. Are these the correct costs to use when calculating your ROI? Do they correlate well with your cost?
Princeton – $8k/year
Berkeley – $17k/year
Duke – $31k/year
7 Likes
I agree with those who say that the rankings are laughable.
But the unis don’t see them that way. They take them really seriously because they know the the rankings drive perception. And…perception = reality.
So we have a weird situation in the US where journalists sitting in offices hold tremendous influence over higher education policy.
Sometimes this influence is for good. But Many times…this is terrible.
I have been looking at the rankings for over 30 years. 30 years ago…it was the Wild West. Harvard would be number 1 in a year and then would tumble to 29. An innovative school (maybe WashU) would fly to number 1 and hold it for a year before it tumbled away. It was great fun and I bet it sold a lot of magazines to panicked or thrilled alums.
Things have settled down a bit, the methodologies have gotten saner…but some of the methodologies used are still cracked to say the least. Some of the changes that USNWR implemented caused some schools to start to take 5 and 6 years to get their degrees finished…which is terrible.
Still, the ranking methodologies have given me my own internal view of what colleges are the best, and, for better or worse much of my knowledge about schools comes from them.
Without them, we would rank schools by sports programs, Hollywood movies, occasional visits and the few unrepresentative people that we know who go to each school.
1 Like
Does the new WSJ rating & ranking methodology account for earning a graduate degree ?
There are a few sub-issues related to my question, but I prefer to focus on the basic question that I have asked.
Thanks for any responses.
2 Likes
No, this is undergrad only and they look at salary five years out, so it undercounts those with professional degrees.
2 Likes
Sort of an ANTI-PhD feeders list . . . .
4 Likes
WSJ did use College Scorecard salary data which is 5 years post-undergrad graduation (and that database only includes those who received federal financial aid.) People in this sample may have earned a graduate degree though, I don’t see anywhere that those people were not included in the College Scorecard database and/or the WSJ analysis.
The WSJ analysis only includes the following students (from their Notes on this page):
Graduate salaries are taken from the U.S. Education Department’s College Scorecard. We looked at median salaries for students first enrolled in 2007-08 and 2008-09 as measured in 2019 and 2020 respectively, and median salaries for students first enrolled in 2009-10 and 2010-11 as measured in 2020 and 2021 respectively.
Someone posted the methodology above, but not the Notes (which are important too):
Notes
Sources and definitions
- To inform this ranking, we commissioned one of the largest-ever independent surveys of verified college students and recent alumni in the U.S. College Pulse conducted a survey of 54,854 students and alumni online, between January and May 2024, which we aggregated with 57,230 survey responses from students and alumni from last year’s survey (removing last year’s responses from alumni who participated again this year) for a total sample size of 112,084. Further information on how College Pulse collects data is available on its methodology page.
- Graduate salaries are taken from the U.S. Education Department’s College Scorecard. We looked at median salaries for students first enrolled in 2007-08 and 2008-09 as measured in 2019 and 2020 respectively, and median salaries for students first enrolled in 2009-10 and 2010-11 as measured in 2020 and 2021 respectively.
- We use median ACT and SAT math exam scores from 2019-22, taken from the U.S. Education Department’s Integrated Postsecondary Education Data System (Ipeds). The median scores are converted into z-scores; we take the average of each z-score weighted in proportion to the number of students submitting each type of score in each year. We take the average from years where data is available back to 2019. For the 26 colleges in the ranking with no available exam score data back to 2019, these are imputed on the basis of the factors that best predict exam results where we do have the data: the proportion of students receiving Pell Grants, the proportion of students with a family income of $110,000 or higher, the admission rate of the college, whether the college accepts life experience as credit in its admissions process, the proportion of students who receive federal loans, the proportion of students receiving institutional grants, and the average faculty salary, in each case averaging available data 2019-22. Our analysis here used research on this topic by the policy-research think tank the Brookings Institution as a guide.
- The cost of living in the state in which the college is located is measured in accordance with regional price parities published by the Bureau of Economic Analysis. We use the latest data available, which relates to 2022.
- Graduation rates from 2019-22 are taken from Ipeds, measuring the proportion of first-time, full-time students studying for four-year bachelor’s degrees who graduate within six years. We take the average of scores across the latest four years of data.
- The proportion of students with family incomes of $110,000 or higher from 2019-22 is taken from the College Scorecard. We take the average of figures across the latest four years of data.
- Where relevant, system-wide exam results and demographic data where not directly provided for a university system in Ipeds are calculated by averaging the relevant figures for each campus, weighted in line with the number of undergraduates at each campus.
- High-school graduates’ salaries by state and across the U.S. are taken from the 2022 U.S. Census Bureau’s American Community Survey, which uses data from 2018 to 2022. We looked at the median salary among people whose highest educational qualification is graduating high school or the equivalent and who are age 25 to 34.
- Average net price for the 2021-22 academic year is taken from the College Scorecard.
- Demographics from 2022 relating to diversity are taken from Ipeds and the College Scorecard.
- Ethnic diversity is measured using the Gini-Simpson Index.
- “Private” in the above table means “Private, not for profit.” We don’t include for-profit colleges in our ranking.
- All scores that aren’t formatted in years and months or in dollars are on a scale of 0 to 100.
- In the event of an exact tie for overall score, the average of the colleges’ scores across the Student Experience, Salary Impact and Social Mobility rankings is used as a tiebreaker to decide rank order.
Eligibility
All U.S. colleges are eligible to be part of our ranking if they meet the following criteria:
- Title IV eligible, i.e., is an accredited university that’s eligible for federal financial aid.
- Awards four-year bachelor’s degrees.
- Located in the 50 states or Washington, D.C.
- Has more than 750 undergraduate students.
- Isn’t insolvent.
- Isn’t for profit.
- We receive at least 50 valid responses from verified students or recent alumni to the student survey.
- The government data for the factors used to compile our ranking is collected and publicly reported.
U.S. service academies aren’t included in the ranking, as government data used in compiling our scores isn’t collected and publicly reported for them.
2 Likes
Agree with the comments above questioning the methodology that the WSJ applied to get a “value added” number. There is definitely a sense of “false precision” if we step back and look at this in a common sense way.
However, I do think there is merit in a ranking/analysis that focuses and weights some measure of ROI, and what is the “value add” of a “Princeton” degree over a “UNC” degree is a question worth exploring. Rather than the convoluted formula the WSJ uses, the bottom line seems to be to look at each major, or perhaps look at a group of majors (Engineering, CS, Math and Physical Science, Humanities/Social Science) and look at graduation rates, employment rates, median salary 1 year after graduation and admit rates to grad or professional school using College Scoreboard and perhaps some other robust survey data. This information would be compared to the overall median in the set subgroups. We could adjust median salary based on some COLA formula if the school predominantly employs their grads in their state/region. A “score” could then be set for each subgroup based on the positive or negative deviation from the median based by major/major group. The scores themselves could be weighted. This way, if I were a CS major, I can see as a general matter if Princeton outcomes are better/worse/indistinguishable from UNC or Podunk U.
On the “I”, of course people should run their own NPC. But I think an easy number to determine the generosity of FA and cost of a college is to use one set of assumptions (e.g. family income of $100k, liquid assets $100k; home equity $100k) and run the COA and use that as a marker for net COA.
2 Likes
No, I didn’t. It’s not that important to me. If the ranking works for some folks, then I’m on board.
I just think a salary contest five years out is an insanely narrow way to think about higher education. It’s fine that there are schools that are focused on business, but it’s less than thought-provoking (at least for me) to put them next to schools that produce graduates whose 5-year salary mark tells a very limited part of the story of what they’ll be. Even if you want to just focus on money, think about kids who land at start-ups who, five years out, are not always earning high cash compensation at the five-year mark.
i don’t understand your point about financial aid. But then again, I can’t see the whole list.
3 Likes
Here are the top 50 colleges, and bottom 10. Just FYI, many community libraries provide digital access to WSJ, if one wants to see the full rankings and/or detailed results for a given school.
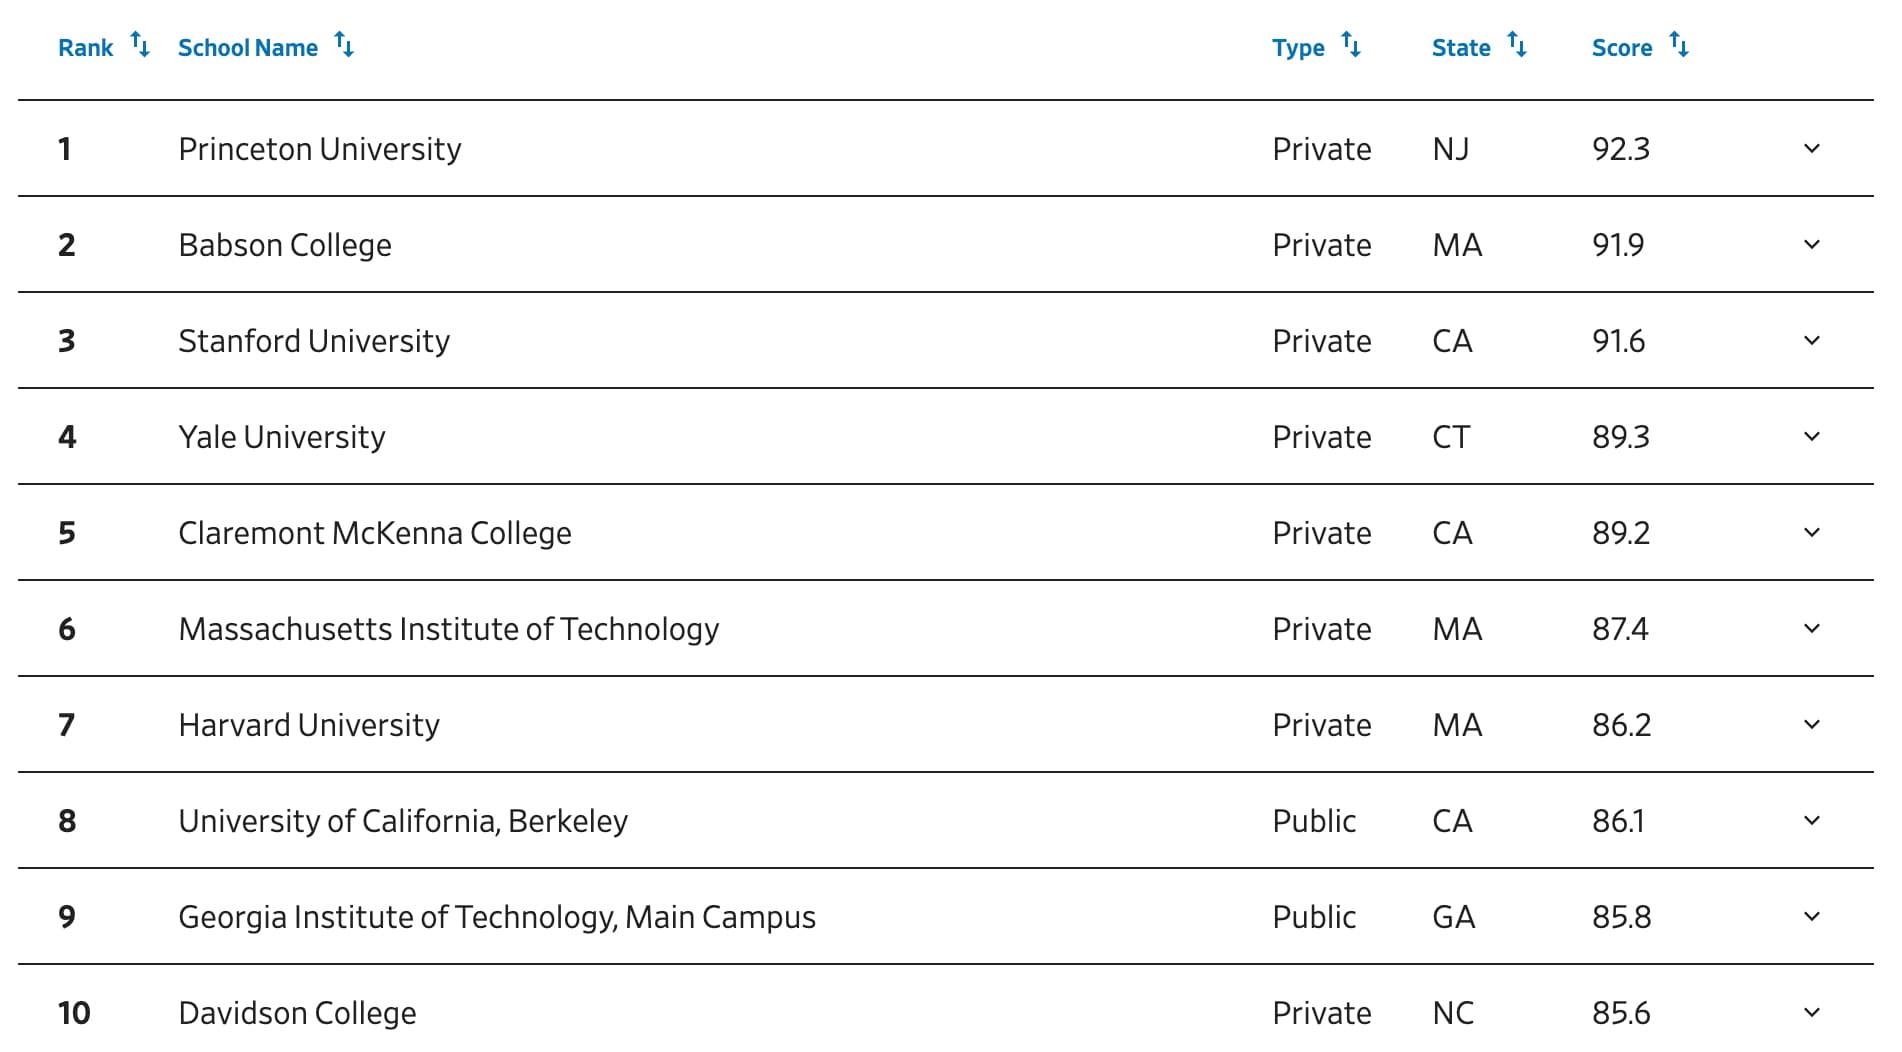

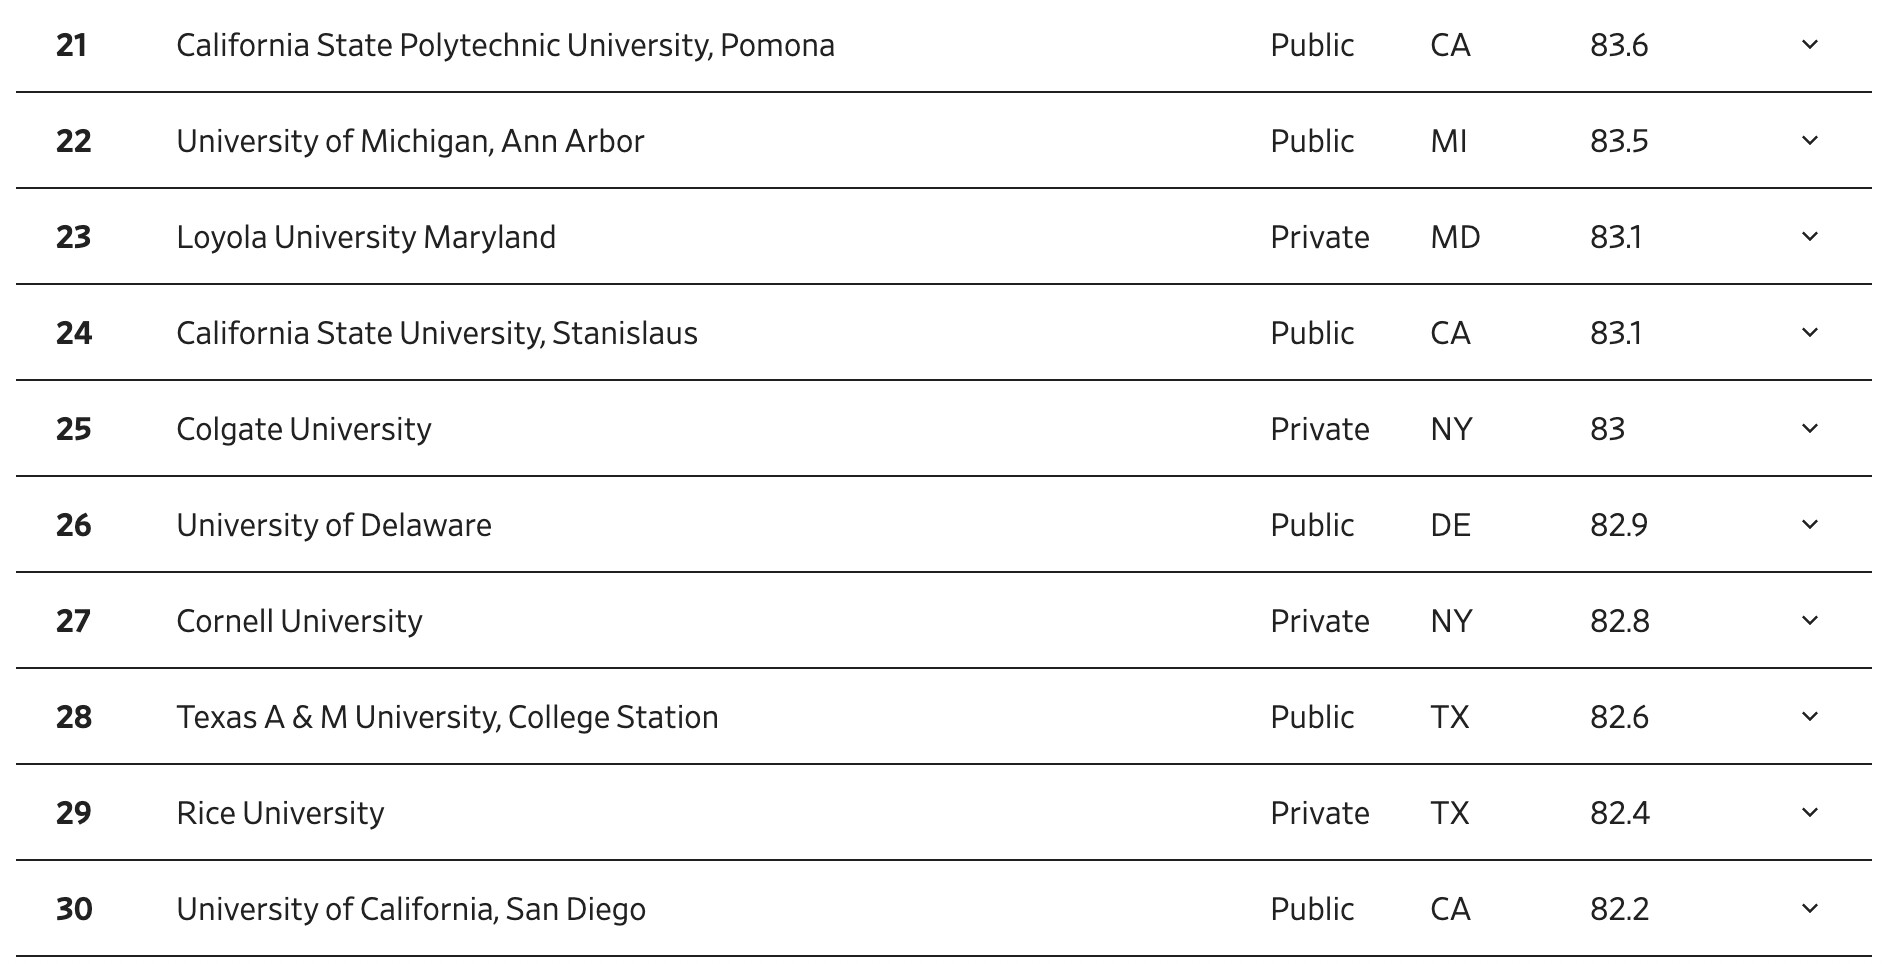
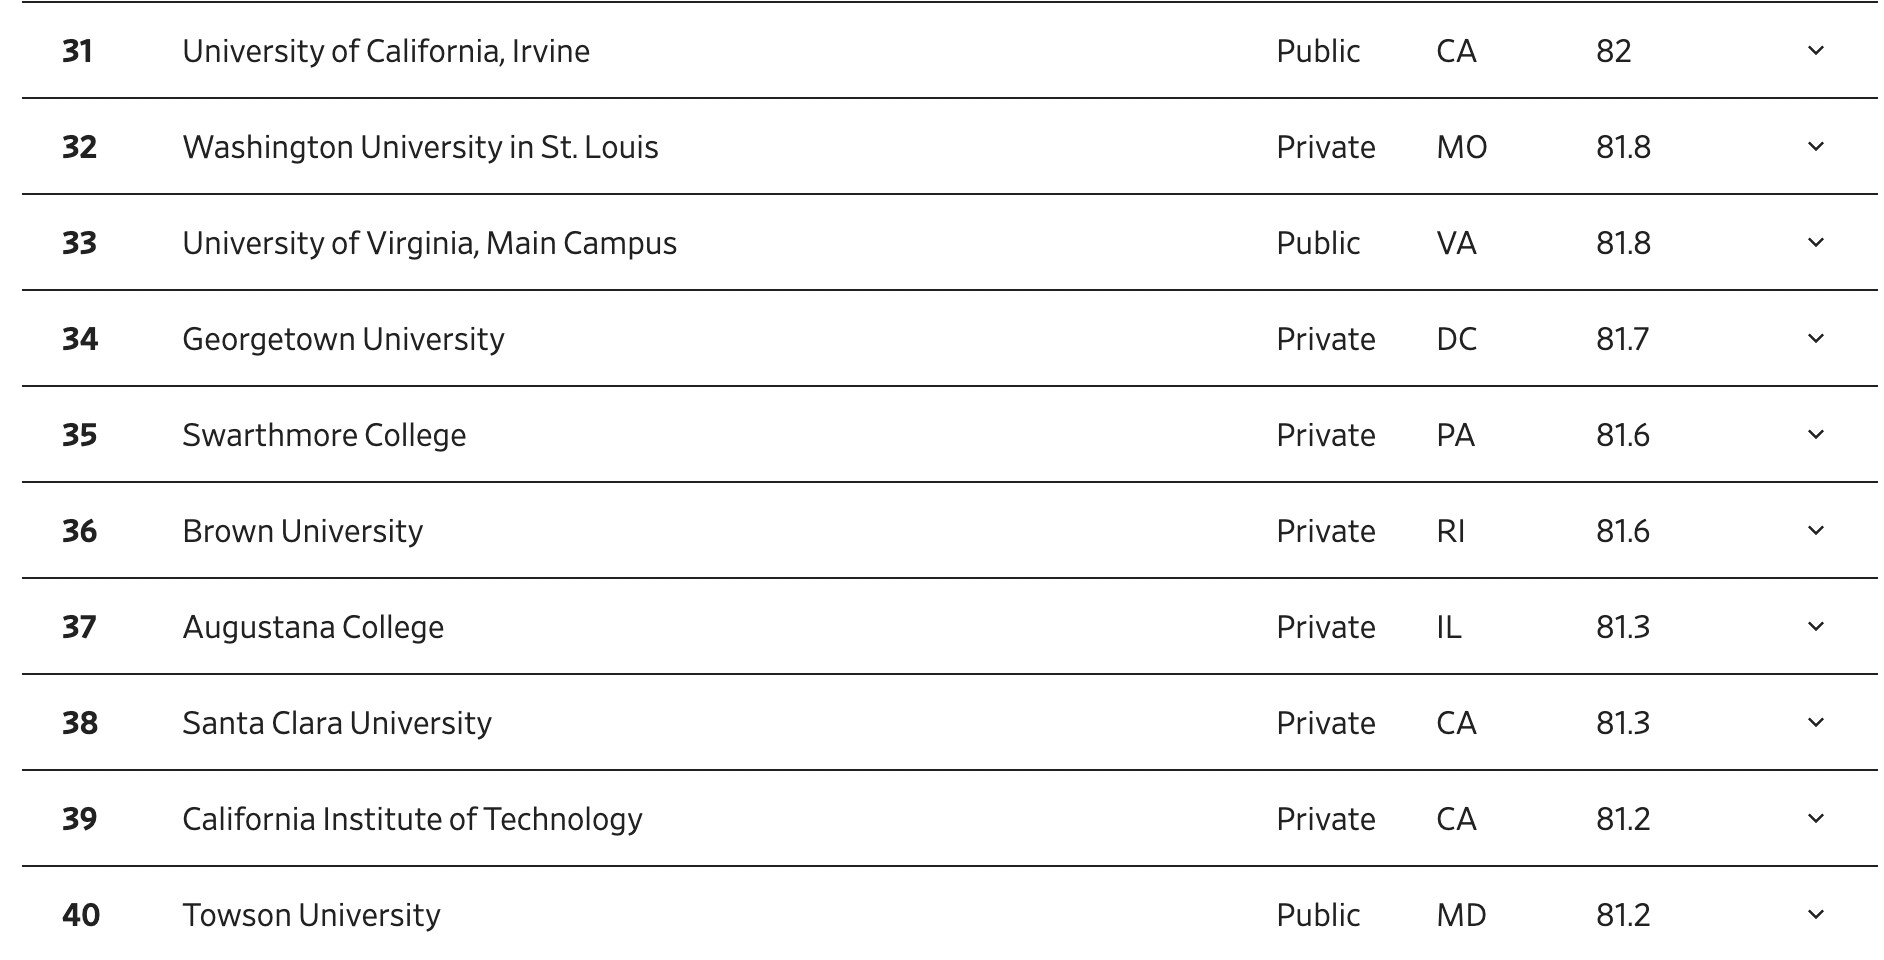

There are 500 colleges in this ranking. Here’s the last 10.

Clicking on the down arrow at the end of each row brings up more information, looks like this:
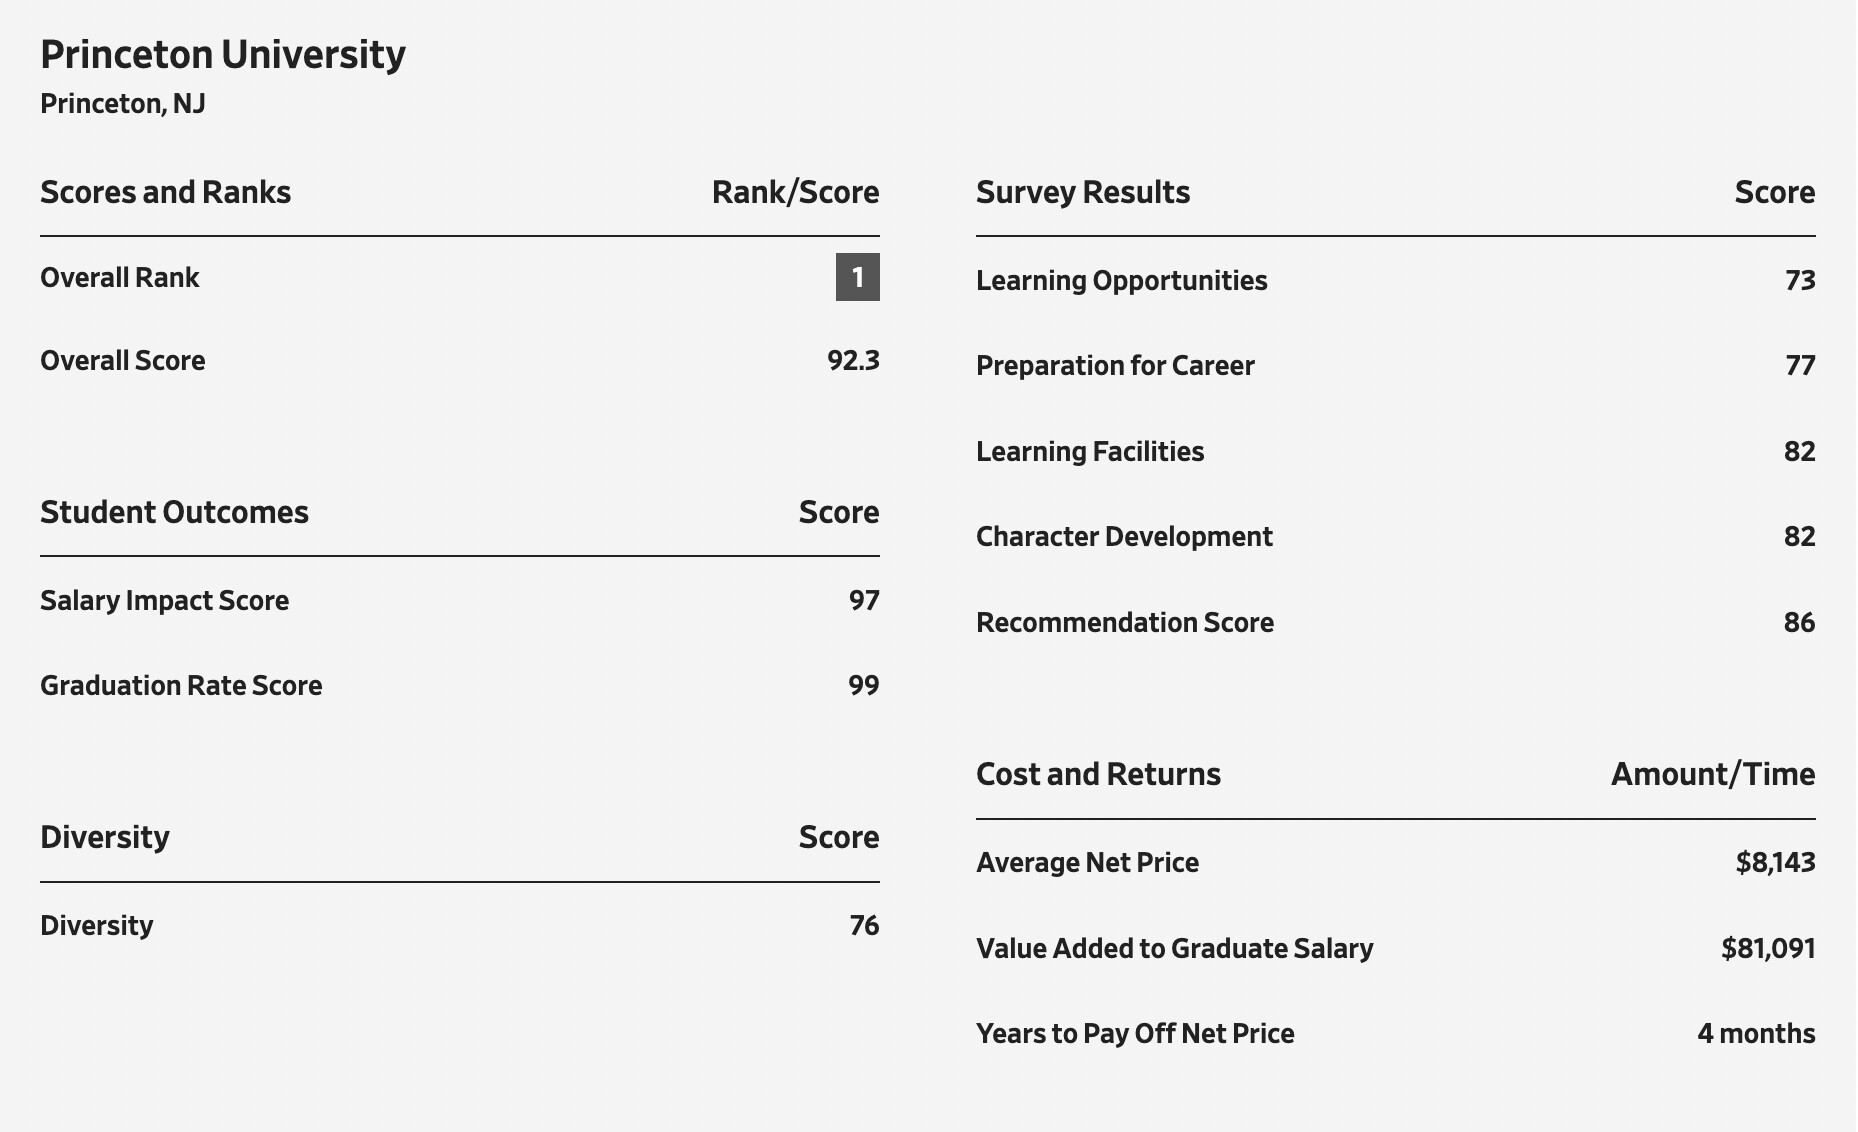
3 Likes
I find the rankings helpful. I get that some people don’t like seeing new names on a top list but with the cost of private colleges approaching 100k/year the ROI on a 300-400k purchase is going to be top of mind for a lot of people.
I visited Davis a few months ago and was surprised at how different the school felt compared to Cal, UCSB or UCSC. There was an openness to help students try different things, work directly with professors while still being focused on a career. I can see how they would score higher than some of the other schools for example talk to UCLA alumni and they will tell you they had a difficult time getting the classes they wanted. Davis also made a point of how they work with tech companies in silicon valley to place students in internships. I don’t know that UCLA spends as much time focused on that. Is Davis better than UCLA ? For financial outcomes I can see that being true. If you want D1 sports and a big city then no. For some people comparing Davis and UCLA is ridiculous and I get that. But even with the lower costs of UCs compared to private schools the ROI is a big factor.
Parent are more involved with their kids decisions than ever before even though we have no idea what the kids working lives will be like. They will be working for another 40 years, think back 40 years ago if our parents tried to guess what areas we should focus on. At the end of the day it’s going to be about each kid’s fit and the area they want to study.
Information at that level of granularity is much more valuable than the aggregate whole-college rankings.
I second that!