WSJ Rankings. Link should be free, but can’t vouch for links within the article.
2 Likes
I stopped reading when I got to #2.
9 Likes
I knew Washington and Lee would place well.
Also that it’s at the top of schools recommended by current students and recent alums. It ranks really high on this metric in every survey I’ve seen, and was something we weighed heavily. I note that other “top” LACs are not as beloved by their students, and my theory is that some substantial percentage attend for prestige reasons, and school fit is lower in the list of priorities. I know a Williams Dean told me as much.
4 Likes
Methodology:
The WSJ/College Pulse 2025 Best Colleges in the U.S. ranking was developed and executed in collaboration with our research partners College Pulse and Statista. The ranking scores colleges based on the following components. The weight each component is given in the ranking is indicated as a percentage. Throughout, we use the latest data available for analysis.
Student outcomes (70%):
- Salary impact (33%): This measures the extent to which a college boosts its graduates’ salaries beyond what they would be expected to earn regardless of which college they attended. We used statistical modeling to estimate what we would expect the median earnings of a college’s graduates to be on the basis of the exam results of its students prior to attending the college and the cost of living in the state in which the college is based. We then scored the college on its performance against that estimate. These scores were then combined with scores for raw graduate salaries to factor in absolute performance alongside performance relative to our estimates. Our analysis for this metric used research on this topic by the policy-research think tank the Brookings Institution as a guide.
- Years to pay off net price (17%): This measure combines two figures—the average net price of attending the college, and the value added to graduates’ median salary attributable to attending the college. The value added to graduates’ median salary by a college was estimated on the basis of the difference between the median earnings of the school’s graduates and the median earnings of high-school graduates in the state where the college is located and across the U.S. in proportion to the ratio of students who are in-state versus out-of-state. We then took the average annual net price of attending the college—including costs like tuition and fees, room and board, and books and supplies, taking into account any grants and scholarships, for students who received federal financial aid—and multiplied it by four to reflect an estimated cost of a four-year program. We then divided this overall net-price figure by the value added to a graduate’s salary, to provide an estimate of how quickly an education at the college pays for itself through the salary boost it provides. Our analysis for this metric used research on this topic by the policy-research think tank Third Way as a guide.
- Graduation rate impact (20%): This is a measure of a college’s performance in ensuring that its students graduate, beyond what would have been expected of the students regardless of which college they attended. We used statistical modeling to estimate what we would expect a college’s graduation rate to be on the basis of the exam results of its students prior to attending the college and the proportion of their students whose family income is $110,000 per year or higher. We then scored the college on its performance against that estimate. These scores were then combined with scores for raw graduation rates to factor in absolute performance alongside performance relative to our estimates.
Learning environment (20%):
- Learning opportunities (4%): The quality and frequency of learning opportunities at the college, based on our student survey. This includes questions about interactions with faculty, feedback and the overall quality of teaching.
- Preparation for career (4%): The quality and frequency of opportunities for students to prepare for their future careers, based on our student survey. This includes questions about networking opportunities, career advice and support, and applied learning.
- Learning facilities (4%): Student satisfaction with the college’s learning-related facilities, based on our student survey. This includes questions about library facilities, internet reliability, and classrooms and teaching facilities.
- Recommendation score (4%): The extent to which students would recommend their college, based on our student survey. This includes questions about whether students would recommend the college to a friend, whether students would choose the same college again if they could start over, and satisfaction with the value for money their college provides.
- Character score (4%): New this year, this measures the extent to which students feel the college has developed character strengths that will help them to make a meaningful contribution to society, including moral courage, hopefulness, resilience, wisdom and a sense of justice, based on our student survey. The questions for this score were developed in collaboration with the Oxford Character Project.
Diversity (10%)
- Opportunities to interact with students from different backgrounds (5%): Student satisfaction with, and frequency of, opportunities to interact with people from different backgrounds, based on our student survey.
- Ethnic diversity (1.7%): The probability that, were you to choose two students or two members of faculty at random, they would be of a different ethnicity from one another; the higher the probability, the higher the score.
- Inclusion of students with lower family earnings (1.7%): The proportion of students receiving Pell Grants; the higher the percentage, the higher the score.
- Inclusion of students with disabilities (1.7%): The proportion of students who are disabled; the higher the percentage, the higher the score.
We also display the following figures to provide context. These are the components of “Years to pay off net price” as explained above:
- Average net price: The average annual overall cost of attending the college, including tuition and fees, room and board, and books and supplies, taking into account any grants and scholarships, for students who received federal financial aid.
- Value added to graduate salary: The value added to graduates’ median salary attributable to attending the college. Estimated on the basis of the difference between the median earnings of the school’s graduates and the median earnings of high-school graduates in the state where the college is located and across the U.S. in proportion to the ratio of students who are in-state versus out-of-state.
2 Likes
I cannot see past #2 in the ranking without a subscription. But I don’t need to see more. Any list of “Best Colleges in the US” with Babson (a college I happen to like very much) ranked #2 I can’t take too seriously. If the survey was entitled “Best ROI (Return on Investment) Colleges” I might feel differently.
As @Northern_Exposure noted above, it is critical to understand the methodology used for any ranking.
14 Likes

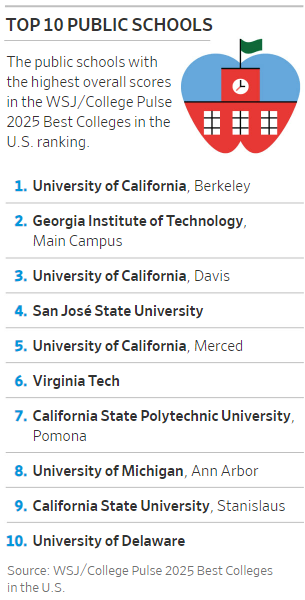
Well, as long as we’re beating this particular ranking to a pulp, which seems deserved, there’s this sub-ranking of the top publics.
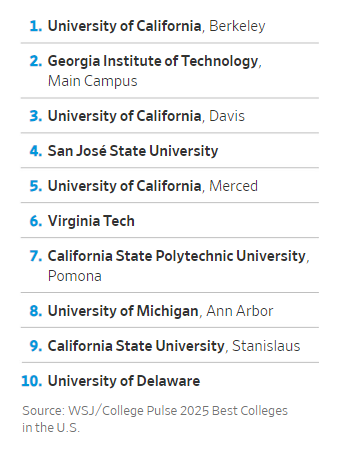
Yep. No UNC Chapel Hill. No UCLA. No UVa. Then there is the decision to rank in the T10 one of the Cal Polys, but pulling the wrong one. Lol. That’s a new one. Also good to see that Cal State Stanislaus rates over the University of Washington. What was I thinking?
As others have said, this was a “glance and chuckle” ranking. The Journal isn’t getting enough attention. Like Scott Galloway.
7 Likes
I always find it interesting to see these lists and see which schools pop up that we don’t talk much about. I, too, was only able to see the top 2 schools on the list (Princeton and Babson…ETA, but the text gave more info and I’ve listed them below), but the link that @BKSquared shared did have some side bars with the Top 10 public schools, Top 10 Preparation for Career, and Top 10 Recommended, which I snipped and shared below. The text also included more of the top 10 ranked schools including:
- Princeton
- Babson
- Stanford
- Yale
- Claremont McKenna
- MIT
- Harvard
- UC - Berkeley
- Georgia Tech
- Davidson
Others mentioned:
11. Bentley
20. Harvey Mudd
29. Rice
And California had 17 of the top 50 schools.
In the public schools category (where California dominated with 6 schools), these were some of the schools we don’t talk much about much, at least not with respect to being one of the top public options in the country:
- UC Davis
- San Jose State
- UC Merced
- Cal Poly Pomona
- Cal State - Stanislaus
- U. of Delaware
For the preparation for a career we had two schools I’ve never heard of (Martin Luther and The Master’s University). There were some very vocationally-minded schools (Babson, Rose-Hulman, and Kettering), but then the other schools are schools that generally aren’t top of mind when thinking about career prep, namely:
- Hampden-Sydney
- Washington & Lee
- Loyola Maryland
- U. of Notre Dame
- Samford (referring to the school in Alabama, not a misspelling of Stanford)

And then we have the schools that students and recent alumni really recommended. Some of the less-often mentioned schools here include:
- Brigham Young
- Dalton State
- The Master’s
- Washington & Lee
- Benedictine
- Hampden-Sydney
- Samford
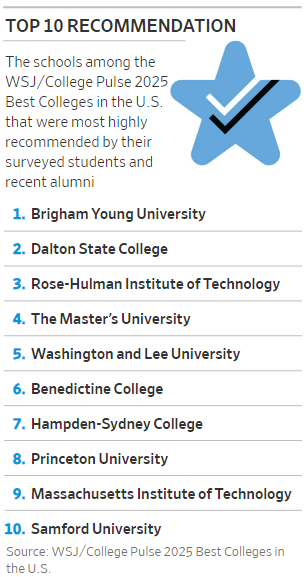
I do remember that Hampden-Sydney was making a number of positive lists on the recent Princeton Review lists that @merc81 shared recently, I believe.
I’ll be back with comments about the methodology.
ETA: Added more info on the rankings of schools mentioned in the article that were not in a sidebar. Davidson coming in at #10 is an example of another school that doesn’t often get mentioned in the same breath as some of the other schools in the top 10.
3 Likes
I’ll admit I have a certain affection for the WSJ rankings.
To be clear, I personally think all generic rankings are silly. But the fun thing about the WSJ rankings to me is they take a certain relatively rigorous valued-added/ROI sort of approach that a lot of defenders of taking the US News rankings (or “prestige” as essentially defined by the US News rankings) claim is the right way to think of colleges. And then when a serious data-driven attempt to give them what they say they want comes out, and it disagrees with what they have been conditioned to expect by the US News–they scoff and immediately dismiss it as laughable.
And again, to be very clear, it IS laughable–but they are ALL laughable. Including the US News rankings that so many people have absorbed as a de facto litmus test for all other rankings.
16 Likes
Many say they are laughable. Many others say they’re gospel. Me? I take them at face value - they measure what they see as valuable. There are consistencies across many of them.
2 Likes
Okay, on to the methodology.
I think student outcomes are important, and I’m a big fan of the graduation rate impact and years to pay off net price. I’ll have to dig in more to see what I think of the salary impact with respect to what a student would have earned at any other college. But the fact that 70% of a school’s rating is based on these three things (and that 1/3 of the total overall rating is based on salary impact) seems WAY too high. Just because one doesn’t choose the most monetarily rewarded fields doesn’t mean anything about the quality of the education one received.
This category was absolutely stunning for me. Assessing the quality of colleges and only giving 20% to the learning environment is just jaw-dropping for me. The quality and frequency of learning opportunities is only worth 4%?!? And that’s worth the same amount as the satisfaction with the facilities?!?!? This area of the methodology was really problematic for me.
I’m all for diversity, but making it worth 50% of the amount that the learning environment is worth is just making me shake my head. I will say that I like the first metric in this category with respect to the satisfaction and frequency of interactions of people from different backgrounds. It doesn’t matter how “diverse” a college is if there aren’t quality interactions between various groups.
Ah, this is where we differ. The omitted schools you mentioned already have their place in the hallowed lists of most. People already know about the quality of education those schools can provide. But just because a school isn’t well-known for its quality doesn’t mean that it’s not providing a quality education. So even when there are lists with whom I take issue with their methodology (ahem), I still think the lists are useful for highlighting schools that we don’t know about and that we might want to investigate further to see if they could be a good option for our own kids. These types of lists are a good resource for finding hidden gems.
(To be clear, inclusion on a list does not make a school a hidden gem, but a different methodology may have identified a school that has otherwise been under the radar and further research on the school beyond the ranking may then help to substantiate it as a gem of a school.)
4 Likes
I mean if you are saying they are a mathematically correct summary of the stated data with the described weightings, then sure, they are all that (probably, apparently there have been some math errors that make it to publication).
But there are extremely basic reasons why no generic rankings could possibly be a applicable to all, or really even many, specific individuals.
Like, for example, cost matters to many individuals, and colleges will offer different costs to different individuals. And this potentially very important factor cannot possibly be included in a generic ranking.
That is just one example, but a good illustration of why this whole idea makes no real sense. But for sure, you can do whatever you claim to be doing in your methodology (hopefully).
Even among the generic rankings, there are many inconsistencies. But sure, they will typically be correlated because they will be using at least some similar (maybe some identical) data sources with some positive weighting.
However, the real question (as far as I am concerned) is how would they match up against individualized rankings based on individualized goals, preferences, costs, contextual factors, and so on.
And we basically know the answer, many of those rankings would look very different, because we help people reach such an individualized list and the people who put real effort into customizing their lists end up all over the place.
So again, even if generic rankings correlate with each other, that doesn’t mean any of them is actually helpful to figuring out which colleges would be best for a given individual. All sorts of specific data might be, but generic rankings? Not really.
1 Like
This WSJ scoring methodology weighs substantially on the outcome; Princeton with its financial aid cuts their average net price per year to $8,143, enabling an average graduate to pay off net price in an astounding 4 months, based on an average salary of $81,091 upon graduation. For comparison, the numbers for selected others are: Babson (#2 overall) : $34,994; 1yr 7 months, $88,350; UC Merced (#18 overall): $13,450; 1 yr 7 months, $33,874.
I don’t know how these numbers were collected or calculated; I am merely transcribing what are in the article.
1 Like
Every individual applicant needs to put in some work. The only list that counts is the one the applicant builds - for better or worse.
2 Likes
So 70% ROI/grad rate, 20% academics, 10% diversity
Ought to be 70% academics, 10% ROI/grad rate, 10% satisfaction, 10% diversity. IMO.
5 Likes
Ought to be those %'s in your situation/opinion… Those %'s will be vary for most of us depending on what we each value… which is why the rankings are generally meaningless at an individual level.
I would say 40% Academics, 40% ROI, 20% Satisfaction
4 Likes
Reported data I have considered at least pretty regularly, when applicable:
- Percent without need receiving merit
- Average merit award
- Endowment per student
- PhD feeders for X, both in total and adjusted for college size
- Number of majors in X, both in total and adjusted for size (a couple times I have looked at Phd feeders adjusted for number of majors in X, which is particularly fun)
- US News Peer Reputation (general)
- US News Peer Reputation (for undergrad teaching)
- Acceptance rates
- GPA and test score ranges for enrolled students
- ARTU (Aggregate Ranking of Top Universities, which includes ARWU, THE, and QS–only used for research university comparisons across borders)
Maybe I should create the AASI (Affordable Academic Snobbery Index). Although I might get sued by the American Association of Snowboard Instructors . . . .
Still, I will not be deterred from making St Olaf into my Babson!
4 Likes
I agree that generic rankings are silly. But, even accepting that each ranking system uses a methodology that reflects different set of values and priorities, they are especially silly when the results vary wildly from year to year. Forbes and WSJ seem to be the worst.
For instance, the WSJ ranked Amherst as the 8th best college/university last year. This year, the WSJ ranked Amherst as the 120th best college/university. That’s quite a fall! Of course, Amherst did not suffer any cataclysmic changes during that time. Rather, I’m pretty sure that Amherst in 2023 was virtually indistinguishable from Amherst in 2024. So either the WSJ’s methodology was deeply flawed last year or it’s deeply flawed this year. But I don’t see how one can ever give any credence to a ranking system that produces wildly inconsistent results on an annual basis notwithstanding the lack of change in the underlying colleges themselves. How can one ever trust their rankings in any given year?
The best thing I can say about USNWR is that they have, consciously I believe, massaged their methodology just enough to produce minor reshufflings each year. Of course, last year was something of an aberration, but even then its rankings were still fairly consistent with previous rankings with a few exceptions like Tulane. Anyhow, part of the secret to USNWR’s ranking success, aside from being first to market, is that their rankings change just enough to generate renewed interest on an annual basis but not enough for most people to challenge their credibility.
10 Likes
What would be really cool is if they had a make your own rankings when you could give a percentage to what you think is most important and the tool would spit out a ranking list for you. Seems like it wouldn’t be hard to do.
3 Likes
The NY Times did something like that last year: Opinion | Build Your Own College Rankings - The New York Times
I think the difficulty is that a number of the metrics that people prioritize can be idiosyncratic, and therefore hard to create an interface around, which is why so many folks end up creating their own spreadsheets so they can track / compare data. I do really like College Navigator for filtering on a number of different axes, but even then you still don’t have variables like “prioritizes undergraduate teaching” or “endowment per student”.
1 Like