Reverse Engineering the "SAT landscape"

After hearing Jay Rosner (interview 195 on the “Your College Bound Kid” podcast) say that the UCs use Landscape even though they are test blind - I went down a rabbit hole on SAT landscape and have even tried to see what I could do to reverse engineer the scores for my neighborhood and school. Below are my thoughts on each section. I’d love feedback and suggestions. If anyone has a college freshman who has reviewed their own file and seen the landscape scores for their school and neighborhood, I’d love to know what they learned!

Link to methodology for SAT landscape:
data-methodology-summary.pdf (collegeboard.org)

Part 1: Basic High school Data
Locale (e.g., Rural)
Senior class size
Percent of students eligible for free and reduced-price lunch
Average SAT® scores at colleges attended
AP® participation and performance

This seem like basic info that would be on the school profile except maybe the Average SAT scores at colleges attended. If the majority of students go to the state flagship that may be a good estimate, but if there is a huge distribution of colleges then that will be harder to understand.

Part 2: Test Score Comparison
Applicant’s test score compared to others from the same high school

If you are applying test blind or test optional then no need to “reverse engineer” this scale. However, if you want to know where a score falls you can often find the SAT for scores at every public high school in your state by looking at the state dept of education website. For example, here is Texas: SAT and ACT Data Search and Data Downloads | Texas Education Agency

Part 3: High School and Neighborhood Indicators
College attendance
Household structure
Median family income
Housing stability
Education levels
Crime
Per the college board “Research shows these indicators are related to students’ education outcomes. Two averages are created based on these six indicators. Values are shown on a scale from 1 to 100 relative to the U.S. average.”

*Trying to reverse engineer this is hard. The US census is used for items 2-5, but it isn’t clear how they determine housing stability or household structure. Regardless the data is very user friendly and once you have an address, the data can be presented by census tract and school district so you at least can see what the raw data is that is used by the college board. *

District of Columbia Public Schools, DC - Profile data - Census Reporter

*The link above came from entering “1600 Pennsylvania Ave. Washington DC” into the address search. If you put your own address into the search bar you will get the data from your census tract and your neighborhood schools. *

*I don’t know how to get the college attendance. The methodology says "The predicted probability that a student from the neighborhood/high school enrolls in a four-year college (aggregate College Board and National Student Clearinghouse data) " I don’t think that data is public. *

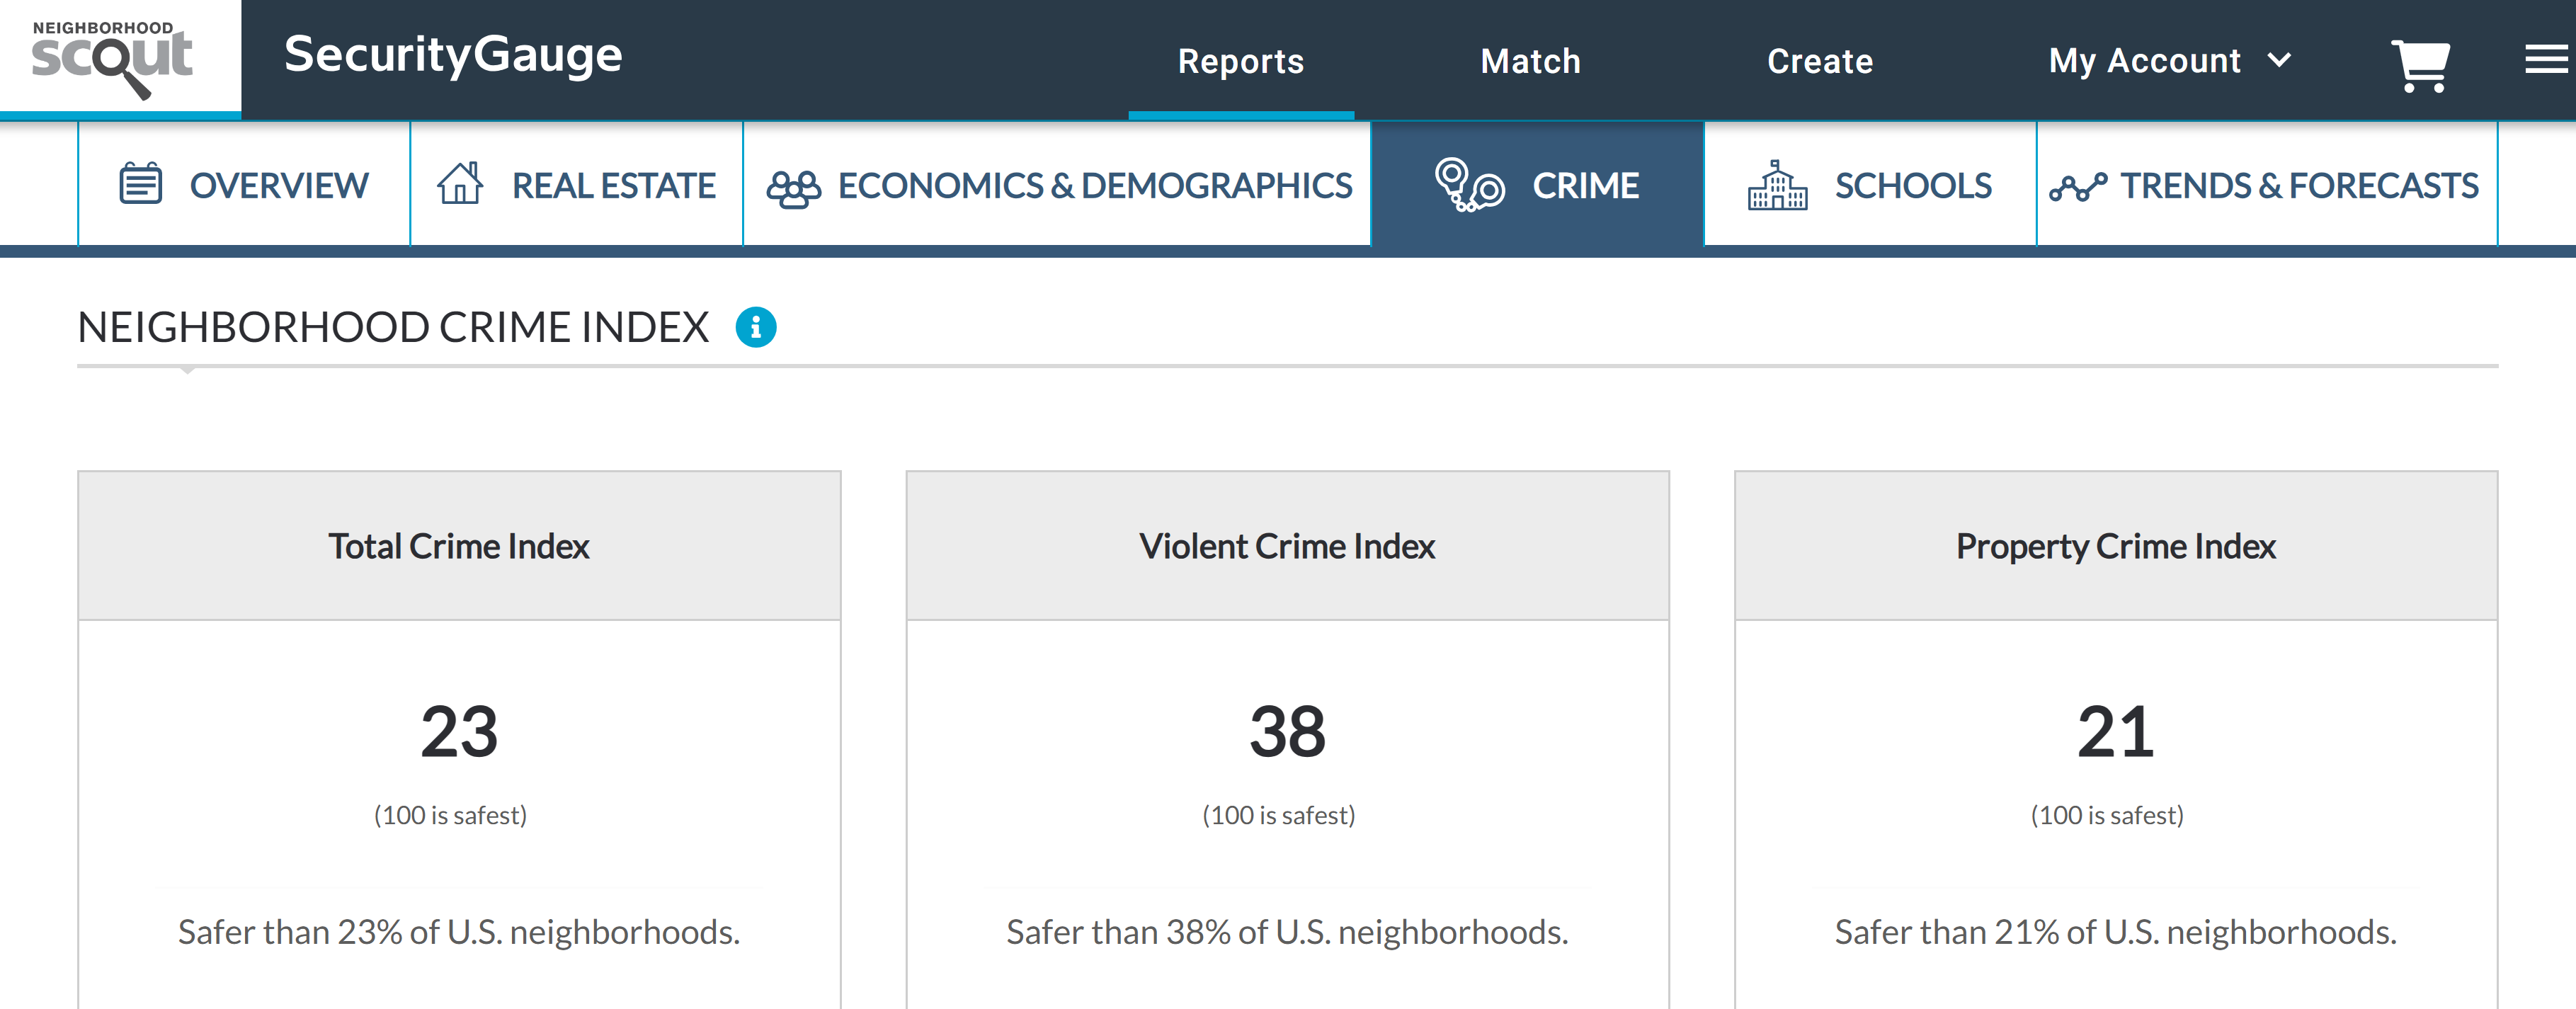
*Crime is " The predicted probability of being a victim of a crime in the neighborhood or neighborhoods represented by the students attending the high school. I did see that Neighborhood scout uses data from the same data broker.

I paid the $30 for my report and got something that looks like this (yikes!).

So, that’s my attempt at reverse engineering the “Landscape” product for the SAT. Feedback? Suggestions? Other data sources? Any interviews anyone has heard about how colleges are using it or which colleges are using it?

1 Like

Trying to understand…are you trying to determine the respective scores for the different demographic/income/location subgroups in your high school?

I am trying to guess my student’s neighborhood challenge score and my student’s school challenge score. These are calculated by the college board and show up in the admission file. Colleges us these scores to understand the context of a student’s environment. In this setting challenge equals adversity. In fact, the college board originally called this the adversity score, but rebranded it as “Landscape”
More information is here:

I understand. Not sure you have enough data to accomplish that with any precision…I mean beyond the known relatively linear relationship between location incomes/wealth and test scores

1 Like

Yeah, agree I am really limited. Hopefully, others here have some insight or experience.

I’m skeptical that UC uses such a service.

UC has given tips to low income and first gen students for years. Beyond that, the top performing high schools are well known to UC app readers as they have been top performing for years and usually exist in upper income neighborhoods. Similarly, the low performing districts are also well known. Just no need to subscribe (pay?) CollegeBoard for info that is public and not rocket science.

I was also very surprised to hear the UCs use Landscape, thus the citation for where I heard that info. I’d love to hear corroboration though. Perhaps admission officers would share if asked, “Does your school use the SAT Landscape product to help inform your holistic review?”

1 Like

The highly rejective school that I read apps for uses Landscape, and it is quite helpful in understanding an application in context. We don’t have any cutoff/target number for a ‘disadvantaged’ applicant.

I don’t know people in admissions at all selective schools but my sense is that many, maybe most, are using CB’s Landscape. No idea how much it costs our institution.

1 Like

For the record, I think that the time spent “reverse engineering the SAT landscape” for your neighborhood would be better spent focusing on other aspects of the application process, but to answer your question about “Any interviews anyone has heard about how colleges are using it or which colleges are using it?” …

They mention Landscape in the Inside the Yale Admissions Office podcast, in episode 36. Also, Opportunity Atlas.

MARK: Thing number two, beginning this fall, admissions officers are going to incorporate a new place based data element from something called Opportunity Atlas. I’m a data wonk guy, so I’m really excited about this. Opportunity Atlas is an ambitious nationwide mapping project run by some economists, and it measures economic mobility at the census tract level.

The data that we get from this are going to complement a bunch of other race neutral place-based data points that are included in a tool that’s called landscape that we’ve used from the College Board now for many years, and this is great because it gives us some excellent insights about where a student has grown up and where they go to school.

JEREMIAH QUINLAN: And I think this is important to understand, even though we are, as we discussed earlier, losing the opportunity and ability to consider one element of a student’s identity, we are going to still be able to consider so many different contextual elements of their background, their neighborhood, the high school they attend, whether if they’re the first in their family to attend college, whether they’re a low income student, whether they’re applying from a neighborhood that has a particularly low level of economic mobility over time. We’ve considered most of these things in the past, and we look forward to considering them, frankly, even more closely than we have in this new landscape.

This. And, even if you were able to precisely calculate your “adversity” score, what would you do with it? How would that information be helpful in your application process? I’m likely missing something, but this seems like a lot of effort with little benefit.

1 Like

Thank you for the feedback! I’d love to know more (obviously). Any public facing training resources or anything you’d feel comfortable sharing?
I found a video by “koodoos” from way back when it was called the adversity score (August 16, 2019). I don’t think I can share a youtube link per forum guidelines. Does it the new landscape look like that? The font and style look a lot like the collegeboard’s infographic. It was interesting to hear how her office gave an extra point if a student had an adversity score >75 or if the school had >60% free lunch. She doesn’t say the school.
Regardless thank you for engaging with my original question!

Thank you so much that’s a great reference! I also really appreciate the link to the opportunity atlas. Our community has been quite engaged on childhood poverty and I’ve seen some data on neighborhoods in my city, but nothing as detailed as that. Its definitely helped me understand some of the local issues we face.

You are right that there are probably better uses for my time. I just get curious.

I’ve thought about this as well, just out of interest. It would be a lot of work, more than it’s worth for a single individual.

But this older Wall Street Journal story somehow got data from the College Board’s previous version, called the “Adversity Score.”

https://www.wsj.com/articles/what-happens-if-sat-scores-consider-adversity-11574773201

I don’t think this will be exactly the same, since it’s based solely on the high school and I think the Landscape also uses data from the census tract surrounding the student’s home, which may differ from the high school (census tracts are actually pretty small). Moreover, the Adversity Score summed all of this up into a single number, and adjustment factor that was applied to the SAT score. People freaked out over this and so the Adversity Score got dropped, but I’d image that more or less the same data filter through in some sense via Landscape. (Probably adjusting the SAT score made more sense for a college that has to process many thousands of applications, but I can understand people getting upset. Still, I wouldn’t be shocked if colleges are currently doing something similar…)

The advantage of Landscape is that, at very low cost, it tells you about the community and school in which the student grew up. The disadvantage is that it gives an admissions advantage to well-off students in lower-income areas while disadvantaging lower-income students in well-off areas.

1 Like

Update: The Adversity Score combined the school score and the neighborhood score. Landscape reports these separately.

2 Likes

Any way to quantify the landscape score/SAT “adjustment” on a linear scale? Asking out of curiousity only, too late for us to move to a lower income area…

That article is fantastic! Thank you so much. Loved typing in famous schools and seeing their scores
Sidwell Friends-3
Harvard Westlake school 9
Choate - 13
Having those examples as well as that of the schools in my area definitely helps me to understand what an “average” school looks like and what the least and most challenged schools look like.

1 Like

If the Adversity Score had been used as a threshold check on applications it would have a very large effect.

As you said, the score for Sidwell Friends was 3, and if applied to the SAT score it would have reduced a student’s measured score by 212 points.

For contrast, the school where my son attends (Klamath Union high school, in OR) had an adversity score of 81 and the SAT would have been boosted by 120 points. That’s a huge deal.

Now, the Landscape scores are used differently in the sense that there’s not a single adjustment score added to the SAT, and it’s very opaque how they’re actually applied to actual application consideration processes. Given the number of applications selective schools receive, I figure they do use some sort of mechanical screening process. The Landscape does produce a 1 to 100 “score” for (I believe) both the high school and the neighborhood in which the student lives. It’s not hard to imagine that being used to screen applicants with decent GPA/SAT but coming from poor areas who might receive some extra attention.

In general, the Adversity/Landscape benefits rich applicants from poor areas over poor applicants from rich areas, because it doesn’t look at the student so much as where they live.

That said, having moved from suburban NY/DC to rural Oregon, a student who wants to succeed academically here faces REAL challenges – few/no truly advanced classes, all the issues that come with low-income schools (disruption, low expectations of students, etc). So getting a boost from Landscape isn’t a freebie…

1 Like

This topic was automatically closed 180 days after the last reply. If you’d like to reply, please flag the thread for moderator attention.